监督学习week 2: 多变量线性回归optional_lab收获记录
目录
1.numpy基础
2.Multiple Variable Linear Regression
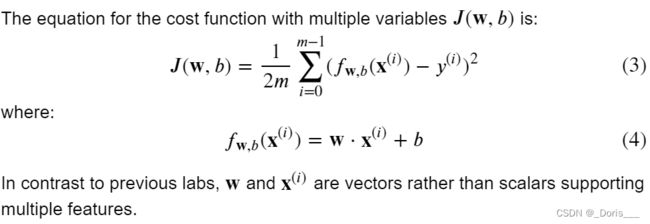
编辑 ①cost function
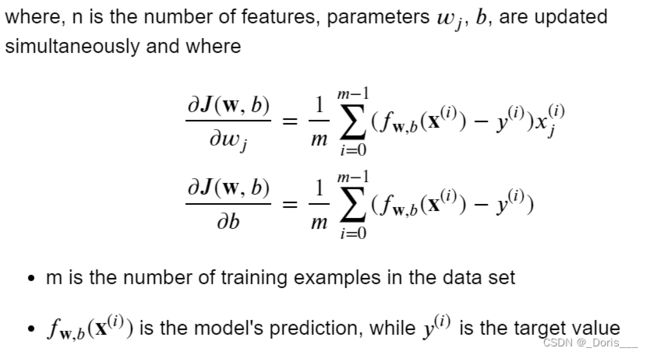
②gradient 编辑
③Gradient Descent With Multiple Variables编辑
④使用&画图
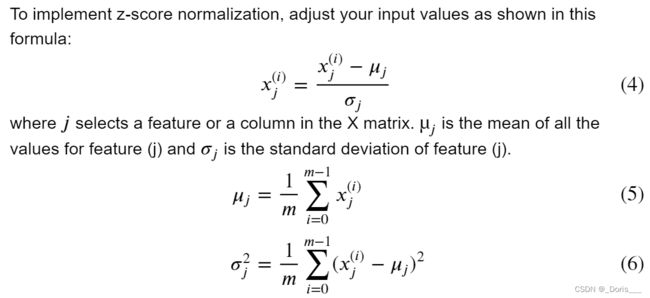
3.Feature Scaling 编辑
4.Feature Engineering and Polynomial Regression
5.其他:完整lab_utils_multi.py
1.numpy基础
①a = np.random.random_sample(4) //生成0-1之间,1D的4个元素的ndarray
②a = np.random.rand(4) //同上
③两个矩阵的点乘.dot 区分线性代数的矩阵乘法a@b 表示矩阵a和矩阵b的矩阵积
④a = np.arange(6).reshape(-1, 2)
//The -1 argument tells the routine to compute the number of rows given the size of the array and the number of columns.
2.Multiple Variable Linear Regression
Recall from the Python/Numpy lab that NumPy
np.dot()[link] can be used to perform a vector dot product.
 ①cost function
def compute_cost(X, y, w, b):
    m = X.shape[0]
    cost = 0.0
    for i in range(m):
        f_wb_i = np.dot(X[i], w) + b           #(n,)(n,) = scalar (see np.dot)
        cost = cost + (f_wb_i - y[i])**2       #scalar
    cost = cost / (2 * m)                      #scalar
    return cost
"""
Args:参数说明
X (ndarray (m,n)): Data, m examples with n features
y (ndarray (m,)) : target values
w (ndarray (n,)) : model parameters
b (scalar) : model parameter
"""
②gradient 
def compute_gradient(X, y, w, b):
    m,n = X.shape           #(number of examples, number of features)
    dj_dw = np.zeros((n,))
    dj_db = 0.

    for i in range(m):
        err = (np.dot(X[i], w) + b) - y[i]
        for j in range(n):
            dj_dw[j] += err * X[i, j]
        dj_db += err
    dj_dw = dj_dw / m
    dj_db = dj_db / m

    return dj_db, dj_dw
③Gradient Descent With Multiple Variables
def gradient_descent(X, y, w_in, b_in, cost_function, gradient_function,
     alpha, num_iters):
    J_history = []
    w = copy.deepcopy(w_in)  #avoid modifying global w within function
    b = b_in

    for i in range(num_iters):

        # Calculate the gradient and update the parameters
        dj_db,dj_dw = gradient_function(X, y, w, b)   ##None

        # Update Parameters using w, b, alpha and gradient
        w = w - alpha * dj_dw               ##None
        b = b - alpha * dj_db               ##None

        # Save cost J at each iteration
        if i<100000:      # prevent resource exhaustion
            J_history.append( cost_function(X, y, w, b))

        # Print cost every at intervals 10 times or as many iterations if < 10
        if i% math.ceil(num_iters / 10) == 0:
            print(f"Iteration {i:4d}: Cost {J_history[-1]:8.2f}   ")

    return w, b, J_history #return final w,b and J history for graphing
④使用&画图
# initialize parameters
initial_w = np.zeros_like(w_init)
initial_b = 0.
# some gradient descent settings
iterations = 1000
alpha = 5.0e-7
# run gradient descent
w_final, b_final, J_hist = gradient_descent(X_train, y_train, initial_w, initial_b,
                                                    compute_cost, compute_gradient,
                                                    alpha, iterations)
print(f"b,w found by gradient descent: {b_final:0.2f},{w_final} ")
m,_ = X_train.shape
for i in range(m):
    print(f"prediction: {np.dot(X_train[i], w_final) + b_final:0.2f}, target value: {y_train[i]}")
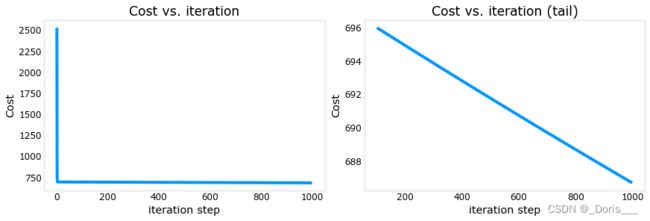
输出: Iteration 0: Cost 2529.46 Iteration 100: Cost 695.99 Iteration 200: Cost 694.92 Iteration 300: Cost 693.86 Iteration 400: Cost 692.81 Iteration 500: Cost 691.77 Iteration 600: Cost 690.73 Iteration 700: Cost 689.71 Iteration 800: Cost 688.70 Iteration 900: Cost 687.69 b,w found by gradient descent: -0.00,[ 0.2 0. -0.01 -0.07] prediction: 426.19, target value: 460 prediction: 286.17, target value: 232 prediction: 171.47, target value: 178
# plot cost versus iteration
fig, (ax1, ax2) = plt.subplots(1, 2, constrained_layout=True, figsize=(12, 4))
ax1.plot(J_hist)
ax2.plot(100 + np.arange(len(J_hist[100:])), J_hist[100:])
ax1.set_title("Cost vs. iteration");  ax2.set_title("Cost vs. iteration (tail)")
ax1.set_ylabel('Cost')             ;  ax2.set_ylabel('Cost')
ax1.set_xlabel('iteration step')   ;  ax2.set_xlabel('iteration step')
plt.show()
These results are not inspiring! Cost is still declining and our predictions are not very accurate. Later will improve on this.
3.Feature Scaling 
After z-score normalization, all features will have a mean of 0 and a standard deviation of 1.(均值为0,标准差为1)
代码实现: 细节(按照axis=0的方向求出每一列的mean和st
def zscore_normalize_features(X):
    # find the mean of each column/feature
    mu     = np.mean(X, axis=0)                 # mu will have shape (n,)
    # find the standard deviation of each column/feature
    sigma  = np.std(X, axis=0)                  # sigma will have shape (n,)
    # element-wise, subtract mu for that column from each example, divide by std for that column
    X_norm = (X - mu) / sigma

    return (X_norm, mu, sigma)
This leaves both features centered at zero with a similar scale.
4.Feature Engineering and Polynomial Regression
We'll use np.c_[..] which is a NumPy routine to concatenate along the column boundary.
//按列进行连接两个矩阵
# create target data
x = np.arange(0, 20, 1)
y = x**2

# engineer features .
X = np.c_[x, x**2, x**3]   #<-- added engineered feature  #注:c_就是按行(左右)进行连接矩阵,r_就是按列(上下)方向连接矩阵
甚至更复杂的图像,也能够被拟合!!
x = np.arange(0,20,1)
y = np.cos(x/2)

X = np.c_[x, x**2, x**3,x**4, x**5, x**6, x**7, x**8, x**9, x**10, x**11, x**12, x**13]
X = zscore_normalize_features(X)

model_w,model_b = run_gradient_descent_feng(X, y, iterations=1000000, alpha = 1e-1)

plt.scatter(x, y, marker='x', c='r', label="Actual Value"); plt.title("Normalized x x**2, x**3 feature")
plt.plot(x,X@model_w + model_b, label="Predicted Value"); plt.xlabel("x"); plt.ylabel("y"); plt.legend(); plt.show()
Iteration         0, Cost: 2.24887e-01
Iteration    100000, Cost: 2.31061e-02
Iteration    200000, Cost: 1.83619e-02
Iteration    300000, Cost: 1.47950e-02
Iteration    400000, Cost: 1.21114e-02
Iteration    500000, Cost: 1.00914e-02
Iteration    600000, Cost: 8.57025e-03
Iteration    700000, Cost: 7.42385e-03
Iteration    800000, Cost: 6.55908e-03
Iteration    900000, Cost: 5.90594e-03
w,b found by gradient descent: w: [-1.61e+00 -1.01e+01  3.00e+01 -6.92e-01 -2.37e+01 -1.51e+01  2.09e+01
 -2.29e-03 -4.69e-03  5.51e-02  1.07e-01 -2.53e-02  6.49e-02], b: -0.0073
5.其他:完整lab_utils_multi.py
##########################################################
# Regression Routines
##########################################################

def compute_gradient_matrix(X, y, w, b):
    """
    Computes the gradient for linear regression

    Args:
      X : (array_like Shape (m,n)) variable such as house size
      y : (array_like Shape (m,1)) actual value
      w : (array_like Shape (n,1)) Values of parameters of the model
      b : (scalar )                Values of parameter of the model
    Returns
      dj_dw: (array_like Shape (n,1)) The gradient of the cost w.r.t. the parameters w.
      dj_db: (scalar)                The gradient of the cost w.r.t. the parameter b.

    """
    m,n = X.shape
    f_wb = X @ w + b
    e   = f_wb - y
    dj_dw  = (1/m) * (X.T @ e)
    dj_db  = (1/m) * np.sum(e)

    return dj_db,dj_dw

#Function to calculate the cost
def compute_cost_matrix(X, y, w, b, verbose=False):
    """
    Computes the gradient for linear regression
     Args:
      X : (array_like Shape (m,n)) variable such as house size
      y : (array_like Shape (m,)) actual value
      w : (array_like Shape (n,)) parameters of the model
      b : (scalar               ) parameter of the model
      verbose : (Boolean) If true, print out intermediate value f_wb
    Returns
      cost: (scalar)
    """
    m,n = X.shape

    # calculate f_wb for all examples.
    f_wb = X @ w + b
    # calculate cost
    total_cost = (1/(2*m)) * np.sum((f_wb-y)**2)

    if verbose: print("f_wb:")
    if verbose: print(f_wb)

    return total_cost

# Loop version of multi-variable compute_cost
def compute_cost(X, y, w, b):
    """
    compute cost
    Args:
      X : (ndarray): Shape (m,n) matrix of examples with multiple features
      w : (ndarray): Shape (n)   parameters for prediction
      b : (scalar):              parameter  for prediction
    Returns
      cost: (scalar)             cost
    """
    m = X.shape[0]
    cost = 0.0
    for i in range(m):
        f_wb_i = np.dot(X[i],w) + b
        cost = cost + (f_wb_i - y[i])**2
    cost = cost/(2*m)
    return(np.squeeze(cost))

def compute_gradient(X, y, w, b):
    """
    Computes the gradient for linear regression
    Args:
      X : (ndarray Shape (m,n)) matrix of examples
      y : (ndarray Shape (m,))  target value of each example
      w : (ndarray Shape (n,))  parameters of the model
      b : (scalar)              parameter of the model
    Returns
      dj_dw : (ndarray Shape (n,)) The gradient of the cost w.r.t. the parameters w.
      dj_db : (scalar)             The gradient of the cost w.r.t. the parameter b.
    """
    m,n = X.shape           #(number of examples, number of features)
    dj_dw = np.zeros((n,))
    dj_db = 0.

    for i in range(m):
        err = (np.dot(X[i], w) + b) - y[i]
        for j in range(n):
            dj_dw[j] = dj_dw[j] + err * X[i,j]
        dj_db = dj_db + err
    dj_dw = dj_dw/m
    dj_db = dj_db/m

    return dj_db,dj_dw

#This version saves more values and is more verbose than the assigment versons
def gradient_descent_houses(X, y, w_in, b_in, cost_function, gradient_function, alpha, num_iters):
    """
    Performs batch gradient descent to learn theta. Updates theta by taking
    num_iters gradient steps with learning rate alpha

    Args:
      X : (array_like Shape (m,n)    matrix of examples
      y : (array_like Shape (m,))    target value of each example
      w_in : (array_like Shape (n,)) Initial values of parameters of the model
      b_in : (scalar)                Initial value of parameter of the model
      cost_function: function to compute cost
      gradient_function: function to compute the gradient
      alpha : (float) Learning rate
      num_iters : (int) number of iterations to run gradient descent
    Returns
      w : (array_like Shape (n,)) Updated values of parameters of the model after
          running gradient descent
      b : (scalar)                Updated value of parameter of the model after
          running gradient descent
    """

    # number of training examples
    m = len(X)

    # An array to store values at each iteration primarily for graphing later
    hist={}
    hist["cost"] = []; hist["params"] = []; hist["grads"]=[]; hist["iter"]=[];

    w = copy.deepcopy(w_in)  #avoid modifying global w within function
    b = b_in
    save_interval = np.ceil(num_iters/10000) # prevent resource exhaustion for long runs

    print(f"Iteration Cost          w0       w1       w2       w3       b       djdw0    djdw1    djdw2    djdw3    djdb  ")
    print(f"---------------------|--------|--------|--------|--------|--------|--------|--------|--------|--------|--------|")

    for i in range(num_iters):

        # Calculate the gradient and update the parameters
        dj_db,dj_dw = gradient_function(X, y, w, b)

        # Update Parameters using w, b, alpha and gradient
        w = w - alpha * dj_dw
        b = b - alpha * dj_db

        # Save cost J,w,b at each save interval for graphing
        if i == 0 or i % save_interval == 0:
            hist["cost"].append(cost_function(X, y, w, b))
            hist["params"].append([w,b])
            hist["grads"].append([dj_dw,dj_db])
            hist["iter"].append(i)

        # Print cost every at intervals 10 times or as many iterations if < 10
        if i% math.ceil(num_iters/10) == 0:
            #print(f"Iteration {i:4d}: Cost {cost_function(X, y, w, b):8.2f}   ")
            cst = cost_function(X, y, w, b)
            print(f"{i:9d} {cst:0.5e} {w[0]: 0.1e} {w[1]: 0.1e} {w[2]: 0.1e} {w[3]: 0.1e} {b: 0.1e} {dj_dw[0]: 0.1e} {dj_dw[1]: 0.1e} {dj_dw[2]: 0.1e} {dj_dw[3]: 0.1e} {dj_db: 0.1e}")

    return w, b, hist #return w,b and history for graphing

def run_gradient_descent(X,y,iterations=1000, alpha = 1e-6):

    m,n = X.shape
    # initialize parameters
    initial_w = np.zeros(n)
    initial_b = 0
    # run gradient descent
    w_out, b_out, hist_out = gradient_descent_houses(X ,y, initial_w, initial_b,
                                               compute_cost, compute_gradient_matrix, alpha, iterations)
    print(f"w,b found by gradient descent: w: {w_out}, b: {b_out:0.2f}")

    return(w_out, b_out, hist_out)

# compact extaction of hist data
#x = hist["iter"]
#J  = np.array([ p    for p in hist["cost"]])
#ws = np.array([ p[0] for p in hist["params"]])
#dj_ws = np.array([ p[0] for p in hist["grads"]])

#bs = np.array([ p[1] for p in hist["params"]])

def run_gradient_descent_feng(X,y,iterations=1000, alpha = 1e-6):
    m,n = X.shape
    # initialize parameters
    initial_w = np.zeros(n)
    initial_b = 0
    # run gradient descent
    w_out, b_out, hist_out = gradient_descent(X ,y, initial_w, initial_b,
                                               compute_cost, compute_gradient_matrix, alpha, iterations)
    print(f"w,b found by gradient descent: w: {w_out}, b: {b_out:0.4f}")

    return(w_out, b_out)

def gradient_descent(X, y, w_in, b_in, cost_function, gradient_function, alpha, num_iters):
    """
    Performs batch gradient descent to learn theta. Updates theta by taking
    num_iters gradient steps with learning rate alpha

    Args:
      X : (array_like Shape (m,n)    matrix of examples
      y : (array_like Shape (m,))    target value of each example
      w_in : (array_like Shape (n,)) Initial values of parameters of the model
      b_in : (scalar)                Initial value of parameter of the model
      cost_function: function to compute cost
      gradient_function: function to compute the gradient
      alpha : (float) Learning rate
      num_iters : (int) number of iterations to run gradient descent
    Returns
      w : (array_like Shape (n,)) Updated values of parameters of the model after
          running gradient descent
      b : (scalar)                Updated value of parameter of the model after
          running gradient descent
    """

    # number of training examples
    m = len(X)

    # An array to store values at each iteration primarily for graphing later
    hist={}
    hist["cost"] = []; hist["params"] = []; hist["grads"]=[]; hist["iter"]=[];

    w = copy.deepcopy(w_in)  #avoid modifying global w within function
    b = b_in
    save_interval = np.ceil(num_iters/10000) # prevent resource exhaustion for long runs

    for i in range(num_iters):

        # Calculate the gradient and update the parameters
        dj_db,dj_dw = gradient_function(X, y, w, b)

        # Update Parameters using w, b, alpha and gradient
        w = w - alpha * dj_dw
        b = b - alpha * dj_db

        # Save cost J,w,b at each save interval for graphing
        if i == 0 or i % save_interval == 0:
            hist["cost"].append(cost_function(X, y, w, b))
            hist["params"].append([w,b])
            hist["grads"].append([dj_dw,dj_db])
            hist["iter"].append(i)

        # Print cost every at intervals 10 times or as many iterations if < 10
        if i% math.ceil(num_iters/10) == 0:
            #print(f"Iteration {i:4d}: Cost {cost_function(X, y, w, b):8.2f}   ")
            cst = cost_function(X, y, w, b)
            print(f"Iteration {i:9d}, Cost: {cst:0.5e}")
    return w, b, hist #return w,b and history for graphing

def load_house_data():
    data = np.loadtxt("./data/houses.txt", delimiter=',', skiprows=1)
    X = data[:,:4]
    y = data[:,4]
    return X, y

def zscore_normalize_features(X,rtn_ms=False):
    """
    returns z-score normalized X by column
    Args:
      X : (numpy array (m,n))
    Returns
      X_norm: (numpy array (m,n)) input normalized by column
    """
    mu     = np.mean(X,axis=0)
    sigma  = np.std(X,axis=0)
    X_norm = (X - mu)/sigma

    if rtn_ms:
        return(X_norm, mu, sigma)
    else:
        return(X_norm)


