2.4微分(动手深度学习v2)
学习目标:
动手深度学习V2(进度:7/73)
学习内容:
小结
- 微分和积分是微积分的两个分支,其中前者可以应用于深度学习中无处不在的优化问题。
- 导数可以被解释为函数相对于其变量的瞬时变化率。它也是函数曲线的切线的斜率。
- 梯度是一个向量,其分量是多变量函数相对于其所有变量的偏导数。
- 链式法则使我们能够微分复合函数。
学习时间:
2021.9.12 10AM
学习产出:
本文
练习题
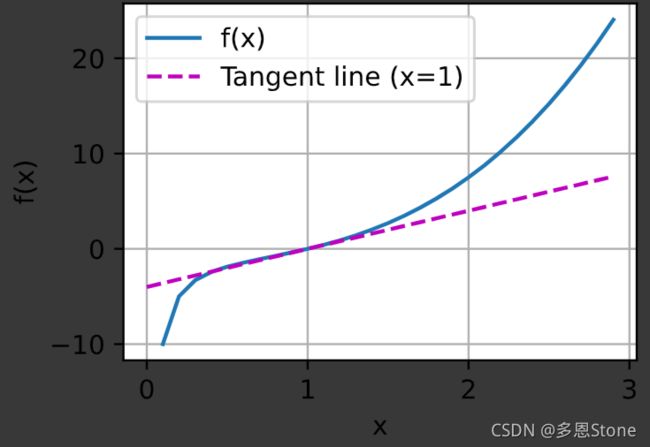
1. 绘制函数 f ( x ) = x 3 − 1 x f ( x ) = x ^ { 3 } - \frac { 1 } { x } f(x)=x3−x1 和其在 x=1 处切线的图像。
#!pip install git+https://github.com/d2l-ai/d2l-zh@release  # installing d2l

%matplotlib inline
import numpy as np
from IPython import display
from d2l import torch as d2l


def f(x):
    return x ** 3 - 1 / x

def numerical_lim(f, x, h):
    return (f(x + h) - f(x)) / h

h = 0.1
for i in range(5):
    print(f'h={h:.5f}, numerical limit={numerical_lim(f, 1, h):.5f}')
    h *= 0.1

def use_svg_display():  #@save
    """使用svg格式在Jupyter中显示绘图。"""
    display.set_matplotlib_formats('svg')

def set_figsize(figsize=(3.5, 2.5)):  #@save
    """设置matplotlib的图表大小。"""
    use_svg_display()
    d2l.plt.rcParams['figure.figsize'] = figsize

#@save
def set_axes(axes, xlabel, ylabel, xlim, ylim, xscale, yscale, legend):
    """设置matplotlib的轴。"""
    axes.set_xlabel(xlabel)
    axes.set_ylabel(ylabel)
    axes.set_xscale(xscale)
    axes.set_yscale(yscale)
    axes.set_xlim(xlim)
    axes.set_ylim(ylim)
    if legend:
        axes.legend(legend)
    axes.grid()

#@save
def plot(X, Y=None, xlabel=None, ylabel=None, legend=None, xlim=None,
         ylim=None, xscale='linear', yscale='linear',
         fmts=('-', 'm--', 'g-.', 'r:'), figsize=(3.5, 2.5), axes=None):
    """绘制数据点。"""
    if legend is None:
        legend = []

    set_figsize(figsize)
    axes = axes if axes else d2l.plt.gca()

    # 如果 `X` 有一个轴,输出True
    def has_one_axis(X):
        return (hasattr(X, "ndim") and X.ndim == 1 or isinstance(X, list)
                and not hasattr(X[0], "__len__"))

    if has_one_axis(X):
        X = [X]
    if Y is None:
        X, Y = [[]] * len(X), X
    elif has_one_axis(Y):
        Y = [Y]
    if len(X) != len(Y):
        X = X * len(Y)
    axes.cla()
    for x, y, fmt in zip(X, Y, fmts):
        if len(x):
            axes.plot(x, y, fmt)
        else:
            axes.plot(y, fmt)
    set_axes(axes, xlabel, ylabel, xlim, ylim, xscale, yscale, legend)

#自行将f(x)=x^3-x^(-1)在x=1处的切线y=4x-4求出来。
x = np.arange(0, 3, 0.1)
plot(x, [f(x), 4 * x - 4], 'x', 'f(x)', legend=['f(x)', 'Tangent line (x=1)'])
在colab上的运行结果如下