机器学习:均值漂移(Mean Shift)详细解释
1. 均值漂移的基本概念
Mean Shift算法和k-means相似,都是一个迭代的过程,即先算出当前点的偏移均值,将该点移动到该偏移均值,以此为新的起始点,继续移动,直到满足最终的条件。
(1)设想在一个有N个样本点的特征空间,初始确定一个中心点center;
(2)计算在设置的半径为D的圆形空间内所有的点(xi)与中心点center的向量;
(3)计算整个圆形空间内所有向量的平均值,得到一个偏移均值
(4)将中心点center移动到偏移均值位置;
(5)重复移动,直到满足一定条件结束。
2. 均值漂移计算
2.1 实施步骤
1、在未被分类的数据点中随机选择一个点作为中心点;
2、找出离中心点距离在带宽之内的所有点,记做集合M,认为这些点属于簇c。
3、计算从中心点开始到集合M中每个元素的向量,将这些向量相加,得到偏移向量。
4、中心点沿着shift的方向移动,移动距离是偏移向量的模。
5、重复步骤2、3、4,直到偏移向量的大小满足设定的阈值要求,记住此时的中心点。
6、重复1、2、3、4、5直到所有的点都被归类。
7、分类:根据每个类,对每个点的访问频率,取访问频率最大的那个类,作为当前点集的所属类。
2.2 第一种方法:Mean Shift基础公式
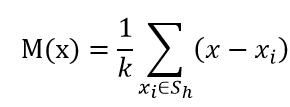
偏移均值(中心点减去每个样本点,然后求和,除以点的个数得到):
这里的S(h)是一个以x为中心点,半径为h的高维球区域,满足以下等式关系的y点的集合,
上面等式中的k值表示在这n个样本点x(i)中,有k个点落入S(h)区域,在上式中,我们可以看到(x(i) - x)是样本x(i)相对于点x的偏移向量,上面式子做的就是落入区域S(h)中的k个样本点相对于点x偏移向量求和然后再平均,那么如果样本点x(i)从一个概率密度函数f(x)中采样得到,由于非零的概率密度梯度指向概率密度增大的最大的方向,
因此从平均上来说,S(h)的样本点更多的是落在沿着概率密度梯度的方向,因此,对应的,
Mean Shift向量M(x)应该指向概率密度梯度的方向。

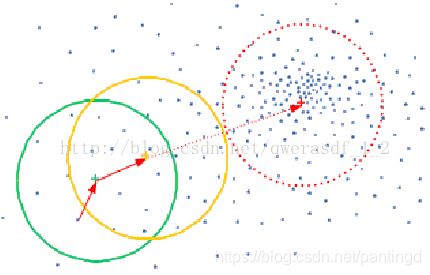
如上图所示,大圆圈所圈住的是S区域,小圆圈表示落入S区域的样本点x(i), 黑色的点就是Mean Shift的基准点x,箭头表示样本点相对于基准点x的偏移向量,很明显我们可以看出,平均的偏移M(x)会指向样本分布最多的区域,也就是概率密度函数梯度的方向。
注:在上面式子中看到,只要是落入S区域的采样点,无论其离中心点x的远近,对最终M(x)的计算的贡献是一样的。然而在这个迭代的过程中,每个x(i)对于求解均值时的贡献是不同的,所以这里引入了其他类型的核函数。
中心点更新,将中心点移动到偏移均值位置:
![]()
Mt为t状态下求得的偏移均值; xt为t状态下的中心
下面讲引入高斯核函数的方式。
2.3 第二种方法:引入核函数改进Mean Shift算法
核函数的定义:
在Mean Shift算法中引入核函数的目的是使得随着样本与被偏移点的距离的不同,其偏移量对均值偏移向量的贡献也不同,下面看下核函数的定义:

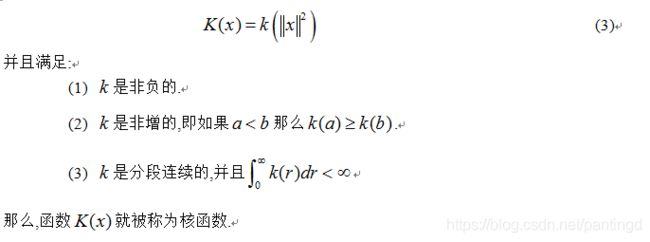
核函数也叫窗口函数,在核估计中起到平滑的作用。
高斯核函数:
高斯核函数只是用来计算映射到高维空间之后的内积的一种简便方法,目的为让低维的不可分数据变成高维可分。利用核函数,可以忽略映射关系,直接在低维空间中完成计算。
引入高斯核函数的偏移均值
在均值漂移中引入核函数的概念,能够使计算中距离中心的点具有更大的权值,反映距离越短,权值越大的特性。改进的偏移均值如下:
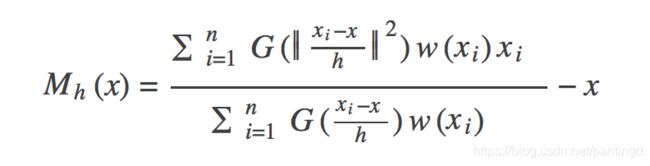
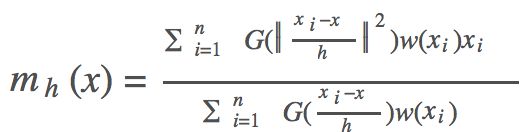
把mh代入Mh则可以得到下列公式,正好印证了梯度上升的过程:

其中,x为中心点;xi为带宽范围内的点;n为带宽范围内的点的数量;g(x)为对核函数的导数求负。
高斯核函数如下公式所示:
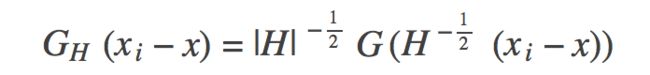
式子中的H如下面这个矩阵。

3. 均值漂移的应用
Mean Shift算法在很多领域都有成功应用,例如图像平滑、图像分割、物体跟踪等,这些属于人工智能里面模式识别或计算机视觉的部分;另外也包括常规的聚类应用。
图像平滑:图像最大质量下的像素压缩;
图像分割:跟图像平滑类似的应用,但最终是将可以平滑的图像进行分离已达到前后景或固定物理分割的目的;
目标跟踪:例如针对监控视频中某个人物的动态跟踪;
常规聚类,如用户聚类等。聚类(K均值聚类)
对象轮廓检验(光线传播算法)
4. Python算法实现
import numpy as np
import matplotlib.pyplot as plt
# Input data set
X = np.array([
    [-4, -3.5], [-3.5, -5], [-2.7, -4.5],
    [-2, -4.5], [-2.9, -2.9], [-0.4, -4.5],
    [-1.4, -2.5], [-1.6, -2], [-1.5, -1.3],
    [-0.5, -2.1], [-0.6, -1], [0, -1.6],
    [-2.8, -1], [-2.4, -0.6], [-3.5, 0],
    [-0.2, 4], [0.9, 1.8], [1, 2.2],
    [1.1, 2.8], [1.1, 3.4], [1, 4.5],
    [1.8, 0.3], [2.2, 1.3], [2.9, 0],
    [2.7, 1.2], [3, 3], [3.4, 2.8],
    [3, 5], [5.4, 1.2], [6.3, 2]
])

def mean_shift(data, radius=2.0):
    clusters = []
    for i in range(len(data)):
        cluster_centroid = data[i]
        cluster_frequency = np.zeros(len(data))

        # Search points in circle
        while True:
            temp_data = []
            for j in range(len(data)):
                v = data[j]
                # Handle points in the circles
                if np.linalg.norm(v - cluster_centroid) <= radius:
                    temp_data.append(v)
                    cluster_frequency[i] += 1

            # Update centroid
            old_centroid = cluster_centroid
            new_centroid = np.average(temp_data, axis=0)
            cluster_centroid = new_centroid
            # Find the mode
            if np.array_equal(new_centroid, old_centroid):
                break
        # Combined 'same' clusters
        has_same_cluster = False
        for cluster in clusters:
            if np.linalg.norm(cluster['centroid'] - cluster_centroid) <= radius:
                has_same_cluster = True
                cluster['frequency'] = cluster['frequency'] + cluster_frequency
                break
        if not has_same_cluster:
            clusters.append({
                'centroid': cluster_centroid,
                'frequency': cluster_frequency
            })
    print('clusters (', len(clusters), '): ', clusters)
    clustering(data, clusters)
    show_clusters(clusters, radius)

# Clustering data using frequency
def clustering(data, clusters):
    t = []
    for cluster in clusters:
        cluster['data'] = []
        t.append(cluster['frequency'])
    t = np.array(t)
    # Clustering
    for i in range(len(data)):
        column_frequency = t[:, i]
        cluster_index = np.where(column_frequency == np.max(column_frequency))[0][0]
        clusters[cluster_index]['data'].append(data[i])

# Plot clusters
def show_clusters(clusters, radius):
    colors = 10 * ['r', 'g', 'b', 'k', 'y']
    plt.figure(figsize=(5, 5))
    plt.xlim((-8, 8))
    plt.ylim((-8, 8))
    plt.scatter(X[:, 0], X[:, 1], s=20)
    theta = np.linspace(0, 2 * np.pi, 800)
    for i in range(len(clusters)):
        cluster = clusters[i]
        data = np.array(cluster['data'])
        plt.scatter(data[:, 0], data[:, 1], color=colors[i], s=20)
        centroid = cluster['centroid']
        plt.scatter(centroid[0], centroid[1], color=colors[i], marker='x', s=30)
        x, y = np.cos(theta) * radius + centroid[0], np.sin(theta) * radius + centroid[1]
        plt.plot(x, y, linewidth=1, color=colors[i])
    plt.show()

mean_shift(X, 2.5)
import numpy as np
import math

MIN_DISTANCE = 0.00001  # 最小误差
def euclidean_dist(pointA, pointB):
    # 计算pointA和pointB之间的欧式距离
    total = (pointA - pointB) * (pointA - pointB).T
    return math.sqrt(total)
def gaussian_kernel(distance, bandwidth):
    ''' 高斯核函数
    :param distance: 欧氏距离计算函数
    :param bandwidth: 核函数的带宽
    :return: 高斯函数值
    '''
    m = np.shape(distance)[0]  # 样本个数
    right = np.mat(np.zeros((m, 1)))
    for i in range(m):
        right[i, 0] = (-0.5 * distance[i] * distance[i].T) / (bandwidth * bandwidth)
        right[i, 0] = np.exp(right[i, 0])
    left = 1 / (bandwidth * math.sqrt(2 * math.pi))
    gaussian_val = left * right
    return gaussian_val

def shift_point(point, points, kernel_bandwidth):
    '''
    计算均值漂移点
    :param point: 需要计算的点
    :param points: 所有的样本点
    :param kernel_bandwidth: 核函数的带宽
    :return:
        point_shifted:漂移后的点
    '''
    points = np.mat(points)
    m = np.shape(points)[0]  # 样本个数
    # 计算距离
    point_distances = np.mat(np.zeros((m, 1)))
    for i in range(m):
        point_distances[i, 0] = euclidean_dist(point, points[i])
    # 计算高斯核
    point_weights = gaussian_kernel(point_distances, kernel_bandwidth)

    # 计算分母
    all = 0.0
    for i in range(m):
        all += point_weights[i, 0]
    # 均值偏移
    point_shifted = point_weights.T * points / all
    return point_shifted
def group_points(mean_shift_points):
    '''
    计算所属的类别
    :param mean_shift_points:漂移向量
    :return: group_assignment:所属类别
    '''
    group_assignment = []
    m, n = np.shape(mean_shift_points)
    index = 0
    index_dict = {}
    for i in range(m):
        item = []
        for j in range(n):
            item.append(str(("%5.2f" % mean_shift_points[i, j])))
        item_1 = "_".join(item)
        if item_1 not in index_dict:
            index_dict[item_1] = index
            index += 1
    for i in range(m):
        item = []
        for j in range(n):
            item.append(str(("%5.2f" % mean_shift_points[i, j])))
        item_1 = "_".join(item)
        group_assignment.append(index_dict[item_1])
    return group_assignment

def train_mean_shift(points, kernel_bandwidth=2):
    '''
    训练Mean Shift模型
    :param points: 特征数据
    :param kernel_bandwidth: 核函数带宽
    :return:
        points:特征点
        mean_shift_points:均值漂移点
        group:类别
    '''
    mean_shift_points = np.mat(points)
    max_min_dist = 1
    iteration = 0
    m = np.shape(mean_shift_points)[0]  # 样本的个数
    need_shift = [True] * m  # 标记是否需要漂移
    # 计算均值漂移向量
    while max_min_dist > MIN_DISTANCE:
        max_min_dist = 0
        iteration += 1
        print("iteration : " + str(iteration))
        for i in range(0, m):
            # 判断每一个样本点是否需要计算偏置均值
            if not need_shift[i]:
                continue
            p_new = mean_shift_points[i]
            p_new_start = p_new
            p_new = shift_point(p_new, points, kernel_bandwidth)  # 对样本点进行偏移
            dist = euclidean_dist(p_new, p_new_start)
             # 计算该点与漂移后的点之间的距离
            if dist > max_min_dist:  # 记录是有点的最大距离
                max_min_dist = dist
            if dist < MIN_DISTANCE:  # 不需要移动
                need_shift[i] = False
            mean_shift_points[i] = p_new
    # 计算最终的group
    group = group_points(mean_shift_points)
    # 计算所属的类别
    return np.mat(points), mean_shift_points, group
以上代码实现了基本的流程,但是执行效率很慢,正式使用时建议使用scikit-learn库中的MeanShift。
scikit-learn MeanShift演示:
import numpy as np
from sklearn.cluster import MeanShift, estimate_bandwidth

data = []
f = open("k_means_sample_data.txt", 'r')#换成自己的数据所在的路径
for line in f:
    data.append([float(line.split(',')[0]), float(line.split(',')[1])])
data = np.array(data)

# 通过下列代码可自动检测bandwidth值
# 从data中随机选取1000个样本,计算每一对样本的距离,然后选取这些距离的0.2分位数作为返回值,当n_samples很大时,这个函数的计算量是很大的。

bandwidth = estimate_bandwidth(data, quantile=0.2, n_samples=1000)
print(bandwidth)

# bin_seeding设置为True就不会把所有的点初始化为核心位置,从而加速算法

ms = MeanShift(bandwidth=bandwidth, bin_seeding=True)
ms.fit(data)
labels = ms.labels_
cluster_centers = ms.cluster_centers_

# 计算类别个数
labels_unique = np.unique(labels)
n_clusters = len(labels_unique)

print("number of estimated clusters : %d" % n_clusters)

# 画图
import matplotlib.pyplot as plt
from itertools import cycle
plt.figure(1)
plt.clf()  # 清楚上面的旧图形
# cycle把一个序列无限重复下去
colors = cycle('bgrcmyk')
for k, color in zip(range(n_clusters), colors):
    # current_member表示标签为k的记为true 反之false

    current_member = labels == k
    cluster_center = cluster_centers[k]

    # 画点
    plt.plot(data[current_member, 0], data[current_member, 1], color + '.')

    #画圈
    plt.plot(cluster_center[0], cluster_center[1], 'o',
             markerfacecolor=color,  #圈内颜色
             markeredgecolor='k',  #圈边颜色
             markersize=14)  #圈大小
plt.title('Estimated number of clusters: %d' % n_clusters)
plt.show()
scikit-learn MeanShift源码分析:
def mean_shift(X, bandwidth=None, seeds=None, bin_seeding=False,
               min_bin_freq=1, cluster_all=True, max_iter=300,
               n_jobs=1):

    """Perform mean shift clustering of data using a flat kernel.
    Read more in the :ref:`User Guide <mean_shift>`.
    Parameters
    ----------
    X : array-like, shape=[n_samples, n_features]
        Input data.
    bandwidth : float, optional
        Kernel bandwidth.
        If bandwidth is not given, it is determined using a heuristic based on
        the median of all pairwise distances. This will take quadratic time in
        the number of samples. The sklearn.cluster.estimate_bandwidth function
        can be used to do this more efficiently.
    seeds : array-like, shape=[n_seeds, n_features] or None
        Point used as initial kernel locations. If None and bin_seeding=False,
        each data point is used as a seed. If None and bin_seeding=True,
        see bin_seeding.
    bin_seeding : boolean, default=False
        If true, initial kernel locations are not locations of all
        points, but rather the location of the discretized version of
        points, where points are binned onto a grid whose coarseness
        corresponds to the bandwidth. Setting this option to True will speed
        up the algorithm because fewer seeds will be initialized.
        Ignored if seeds argument is not None.
    min_bin_freq : int, default=1
       To speed up the algorithm, accept only those bins with at least
       min_bin_freq points as seeds.
    cluster_all : boolean, default True
        If true, then all points are clustered, even those orphans that are
        not within any kernel. Orphans are assigned to the nearest kernel.
        If false, then orphans are given cluster label -1.
    max_iter : int, default 300
        Maximum number of iterations, per seed point before the clustering
        operation terminates (for that seed point), if has not converged yet.
    n_jobs : int
        The number of jobs to use for the computation. This works by computing
        each of the n_init runs in parallel.
        If -1 all CPUs are used. If 1 is given, no parallel computing code is
        used at all, which is useful for debugging. For n_jobs below -1,
        (n_cpus + 1 + n_jobs) are used. Thus for n_jobs = -2, all CPUs but one are used.
        .. versionadded:: 0.17
           Parallel Execution using *n_jobs*.
  Returns
    -------
    cluster_centers : array, shape=[n_clusters, n_features]
        Coordinates of cluster centers.
    labels : array, shape=[n_samples]
        Cluster labels for each point.
    Notes
    -----
    See examples/cluster/plot_mean_shift.py for an example.
    """
    #没有定义bandwidth执行函数estimate_bandwidth估计带宽
    if bandwidth is None:
        bandwidth = estimate_bandwidth(X, n_jobs=n_jobs)
    #带宽小于0就报错
    elif bandwidth <= 0:
        raise ValueError("bandwidth needs to be greater than zero or None,\got %f" % bandwidth)
    #如果没有设置种子
    if seeds is None:
        #通过get_bin_seeds选取种子
        #min_bin_freq指定最少的种子数目
        if bin_seeding:
            seeds = get_bin_seeds(X, bandwidth, min_bin_freq)
        #把所有点设为种子
        else:
            seeds = X
    #根据shape得到样本数量和特征数量
    n_samples, n_features = X.shape
    #中心强度字典 键为点 值为强度
    center_intensity_dict = {}
    #近邻搜索 fit的返回值为
    #radius意思是半径 表示参数空间的范围
    #用作于radius_neighbors 可以理解为在半径范围内找邻居
    nbrs = NearestNeighbors(radius=bandwidth, n_jobs=n_jobs).fit(X)
    #并行地在所有种子上执行迭代
    #all_res为所有种子的迭代完的中心以及周围的邻居数
    # execute iterations on all seeds in parallel
    all_res = Parallel(n_jobs=n_jobs)(
        delayed(_mean_shift_single_seed)
        (seed, X, nbrs, max_iter) for seed in seeds)
    #遍历所有结果
    # copy results in a dictionary
    for i in range(len(seeds)):
        #只有这个点的周围没有邻居才会出现None的情况
        if all_res[i] is not None:
            #一个中心点对应一个强度(周围邻居个数)
            center_intensity_dict[all_res[i][0]] = all_res[i][1]
    #要是一个符合要求的点都没有,就说明bandwidth设置得太小了
    if not center_intensity_dict:
        # nothing near seeds
        raise ValueError("No point was within bandwidth=%f of any seed."
                         " Try a different seeding strategy \
                         or increase the bandwidth."
                         % bandwidth)
    # POST PROCESSING: remove near duplicate points
    # If the distance between two kernels is less than the bandwidth,
    # then we have to remove one because it is a duplicate. Remove the
    # one with fewer points.
    #按照强度来排序
    #dict.items()返回值形式为[(key1,value1),(key2,value2)...]
    #reverse为True表示由大到小
    #key的lambda表达式用来指定用作比较的部分为value
    sorted_by_intensity = sorted(center_intensity_dict.items(),
                                 key=lambda tup: tup[1], reverse=True)
    #单独把排好序的点分出来
    sorted_centers = np.array([tup[0] for tup in sorted_by_intensity])
    #返回长度和点数量相等的bool类型array
    unique = np.ones(len(sorted_centers), dtype=np.bool)
    #在这些点里再来一次找邻居
    nbrs = NearestNeighbors(radius=bandwidth,                          n_jobs=n_jobs).fit(sorted_centers)
    '''
    enumerate返回的是index,value
    还是类似于之前的找邻居 不过这次是为了剔除相近的点 就是去除重复的中心,因为是按强度由大到小排好序的 所以优先将靠前的当作确定的中心
    '''
    for i, center in enumerate(sorted_centers):
        if unique[i]:
            neighbor_idxs = nbrs.radius_neighbors([center],                                                  return_distance=False)[0]
            #中心的邻居不能作为候选
            unique[neighbor_idxs] = 0
            #因为这个范围内肯定包含自己,所以要单独标为1
            unique[i] = 1
            # leave the current point as unique
            #把筛选过后的中心拿出来 就是最终的聚类中心
    cluster_centers = sorted_centers[unique]
    '''
    分配标签:最近的类就是这个点的类
    ASSIGN LABELS: a point belongs to the cluster that it is closest to
    把中心放进去 用kneighbors来找邻居
    n_neighbors标为1 使找到的邻居数为1 也就成了标签
    '''
    nbrs = NearestNeighbors(n_neighbors=1, n_jobs=n_jobs).fit(cluster_centers)
    #labels用来存放标签
    labels = np.zeros(n_samples, dtype=np.int)
    #所有点带进去求
    distances, idxs = nbrs.kneighbors(X)
    #cluster_all为True表示所有的点都会被聚类
    if cluster_all:
        #flatten可以简单理解如下
        #>>> np.array([[[[1,2]],[[3,4]],[[5,6]]]]).flatten()
        #array([1, 2, 3, 4, 5, 6])

        labels = idxs.flatten()
    #为False就把距离大于bandwidth的点类别标为-1
    else:
        #先全标-1
        labels.fill(-1)
        #距离小于bandwidth的标False
        bool_selector = distances.flatten() <= bandwidth
        #标True的才能参与聚类

        labels[bool_selector] = idxs.flatten()[bool_selector]
    #返回的结果为聚类中心和每个样本的标签
    return cluster_centers, labels
# separate function for each seed's iterative loop
def _mean_shift_single_seed(my_mean, X, nbrs, max_iter):
    #对于每个种子,梯度上升,直到收敛或者到达max_iter次迭代次数
    # For each seed, climb gradient until convergence or max_iter
    bandwidth = nbrs.get_params()['radius']
    #表示收敛时的阈值
    stop_thresh = 1e-3 * bandwidth  # when mean has converged
    #记录完成的迭代次数
    completed_iterations = 0
    while True:
        '''
        radius_neighbors寻找my_mean周围的邻居
        i_nbrs是符合要求的邻居的下标
        Find mean of points within bandwidth
        '''
        i_nbrs = nbrs.radius_neighbors([my_mean], bandwidth,                                       return_distance=False)[0]
        #根据下标找点
        points_within = X[i_nbrs]
        #找不到点就跳出迭代
        if len(points_within) == 0:
            break  # Depending on seeding strategy this condition may occur
        #保存旧的均值
        my_old_mean = my_mean  # save the old mean
        #移动均值,这就是mean-shift名字的由来,每一步的迭代就是计算新的均值点
        my_mean = np.mean(points_within, axis=0)
        '''
        用欧几里得范数与阈值进行比较判断收敛 或者
        判断迭代次数达到上限
        If converged or at max_iter, adds the cluster
        '''
        if (extmath.norm(my_mean - my_old_mean) < stop_thresh or
                completed_iterations == max_iter):
            #返回收敛时的均值中心和周围邻居个数
            #tuple表示转换成元组 因为之后的center_intensity_dict键不能为列表

            return tuple(my_mean), len(points_within)
        #迭代次数增加
        completed_iterations += 1
参考文献
- 均值漂移运算
- 均值漂移计算
- https://blog.csdn.net/jiaoyangdetian/article/details/79426078
- 算法实现-源码地址