R语言按某一列分类求均值+绘图总结
D<-aggregate(.~K,data=data1,mean)  #求数据集data1按照K分类后所有列的均值

rm(list=ls())   #删除所有对象

attach()  #锁定某个对象
with(mtcars,{print(summary(mpg)),plot(mpg,disp)}  #with作用等同attach

grades<-read.table('student.csv',header=TRUE,row.namens='studentid',sep=',')
#读表

dev.new()  #开启新图框
dev.off()  #关闭图框
dose<-c(20,30,40,50,60)
drugA<-c(16,20,25,35,42)
drugB<-c(20,35,46,61,70)
opar<-par(no.readonlyTRUE)
par(pin=c(2,3))   #图片尺寸
par(cex.axis=.75,font.axis=3)
par(lwd=2,cex=1.5)
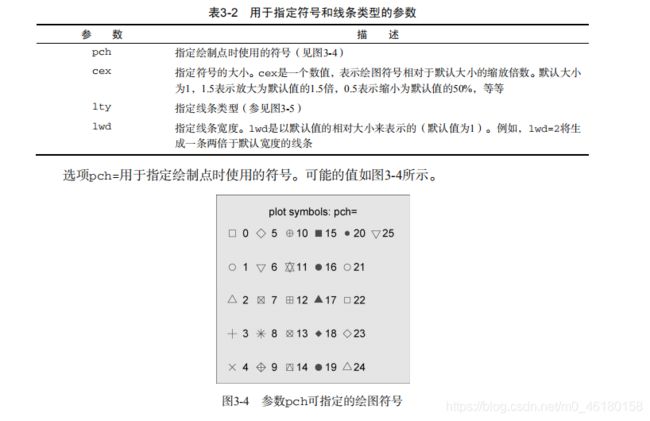
plot(dose,drugA,type='b',pch=19,lty=2,col='red')
plot(dose,drug,type='b',pch=23,lty=6,col='blue',bg='green')
par(opar)
plot(dose,drugA,type='b',col='red',
lty=2,pch=2,lwd=2,main='clain',
sub='this is',xlab='dosa',ylab='drug',
xlim=c(0,60),ylim=c(0,70))
图例
#legend(location,title,legend)

dose<-c(20,30,40,50,60)
drugA<-seq(1,10,2)
drugB<-seq(2,20,2)
opar<-par(no.readonly=TRUE)
par(lwd=2,cex=1.5,font.lab=2)
plot(dose,drugA,type='b',pch=15,lty=1,
col='blue',ylim=c(0,60),main='that',
xlab='drug',ylab='resopme')
lines(dose,drugB,type='b',pch=17,lty=2,col='blue')

legend('topleft',inset=0.05,title='main',c('A','B'),lty=c(1,2),
pch=c(15,17),col=c('red','blue'))
par(opar)
画2*2图:
attach(mtcars)
opar<-par(no.readonly=TRUE)
par(mfrow=c(2,2))
plot(wt,mpg,main='11')
plot(wt,disp,main='xx')
hist(wt,main='dd')
boxplot(wt,main='ds')
par(opar)
detach(mtcars)
画3*1图:
attach(mtacars)
opar<-par(no.readonly=TRUE)
par(mfrow=c(3,1))
hist(wt)
hist(disp)
hist(mpg)
par(opar)
detach(mtcars)
第一幅图在第一行,第二三副图在第二行:
attach(mtcars)
opar<-par(no.readonly=TRUE)
layout(matrix(c(1,1,2,3)2,2,byrow=TRUE))
hist(wt)
hist(mpg)
hist(disp)
detach(macars)


