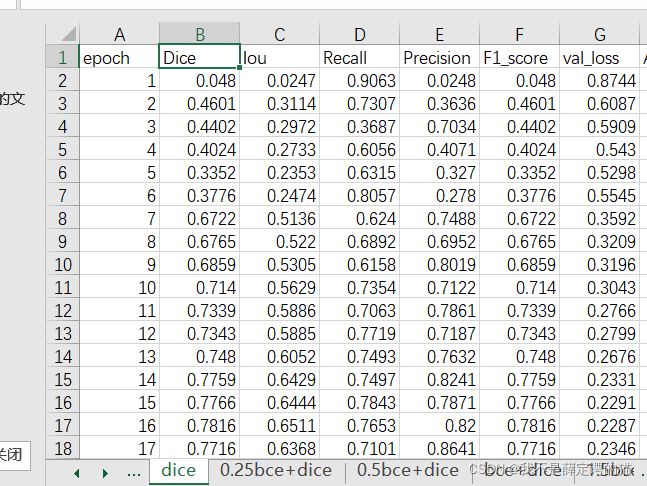
用python将excel中的数据画为曲线图(x_y)

如上图所示,使用epoch作为横坐标,dice做纵坐标画曲线图。其中一个sheet画一条曲线,将多个sheet的曲线画到一张图中。
import xlrd
import numpy as np
import matplotlib.pyplot as plt

'''
xlrd中单元格的数据类型
数字一律按浮点型输出,日期输出成一串小数,布尔型输出0或1,所以我们必须在程序中做判断处理转换
成我们想要的数据类型
0 empty,1 string, 2 number, 3 date, 4 boolean, 5 error
'''

#  根据sheer的名字来获取整个表
def readExcelDataByName(fileName, sheetName):
    data = xlrd.open_workbook(fileName)
    table = data.sheet_by_name(sheetName)

    return table

#  根据sheer的序号来获取整个表
def readExcelDataByIndex(fileName, sheetIndex):
    table = None
    errorMsg = ""
    try:
        data = xlrd.open_workbook(fileName)
        table = data.sheet_by_index(sheetIndex)
    except Exception as msg:
        errorMsg = msg
    return table, errorMsg


# 根据这个列的名字获取这个列的索引
def getColumnIndex(table, columnName):
    columnIndex = None
    #print table
    name = table.name #获取工作表的名称
    rowNum = table.nrows #获取工作表的行数
    colNum = table.ncols #获取工作表的列数

    _= table.row_values(0) #获取工作表第一行的所有字段列表
    for i in range(table.ncols):
        #print columnName
        #print table.cell_value(0, i)
        if(table.cell_value(0, i) == columnName):
            columnIndex = i
            break
    return columnIndex

# 创建动态数组
def get_dynamic_list(names):
    createVar = globals()  #globals() 函数会以字典类型返回当前位置的全部全局变量。
    # createVar = locals() # locals() 函数会以字典类型返回当前位置的全部局部变量。
    for i in range(len(names)):
        createVar[names[i]] = list()
# 创建动态变量
def get_dynamic_variables(names):
    createVar = globals()  #globals() 函数会以字典类型返回当前位置的全部全局变量。
    # createVar = locals() # locals() 函数会以字典类型返回当前位置的全部局部变量。
    for i in range(len(names)):
        createVar[names[i]] =''        # 以字典的的形式加入后就相当于再全局变量中加入了你创建的变量

# 通过该列的列名clo_name读取该列的数据
def read_oneCol_byName(filepath,sheer_name,clo_name):
    table=readExcelDataByName(filepath,sheer_name)
    clo_id=getColumnIndex(table,clo_name)
    n_row=table.nrows  #
    results=[]
    for value in range(0,n_row):
        results.append(table.cell_value(value,clo_id))


# 通过该列的列名clo_name读取该列的数据
def read_oneCol_byColId(filepath,sheer_name,clo_id):
    table=readExcelDataByName(filepath,sheer_name)
    n_row=table.nrows  # 获取行数
    results=[]
    for value in range(0,n_row):
        results.append(table.cell_value(value,clo_id))

# 动态的通过的列名clo_name读取这些列的数据
def read_Cols_byColName(filepath,sheer_name,clo_names,start_index=False,end_index=False):
    #filepath是excel表的路径
    #clo_names 是一个list,是所需返回的列的名字
    table=readExcelDataByName(filepath,sheer_name)
    n_row=table.nrows  # 获取行数
    print(' 总行数为',n_row)
    get_dynamic_list(clo_names) #根据列名动态创建装每一个列的值的list
    row_ids=[] #这个列表用于装这些列各自所在索引
    for col_name in clo_names:
        row_ids.append(getColumnIndex(table,col_name))
    get_dynamic_list(clo_names)

    get_Var = globals()  #globals() 函数会以字典类型返回当前位置的全部全局变量。

    if start_index:
        pass
    else:
        start_index=0
    if end_index:
        pass
    else:
        end_index=n_row
    for value in range(start_index,end_index):
        i=0
        for name in clo_names:  #这整个for循环用于添加整个被选择的一行的数据
            get_Var[name].append(table.cell_value(value,row_ids[i]))
            i=i+1

#

if __name__ == '__main__':
    get_Var = globals()
    # filepath=r'D:\JUN\water_leakage\新衡量标准\________Deep_Supervision\6月3日water\loss_compare\loss\LOSS.xls'
    filepath = r'H:\copy windows\6.13water\loss_compare\loss\LOSS.xls'
    sheer_name1 = 'BCE'
    sheer_name2 = 'Dice'
    sheer_name3 = 'BCE+Dice'
    sheer_name4 = '0.5BCE+Dice'
    sheer_name5 = '2BCE+Dice'
    sheer_name6 = '0.25BCE+Dice'
    sheer_name7 = '1.5BCE+Dice'
    clo_name='Iou'
    clo_names=['epoch','Dice']  #想要画出excel表中的哪两列数据,写这两列数据的列名

    fig= plt.figure()
    plt.ylim(0.65, 0.95)
    # ax = fig.add_subplot(111)
    # ax.set(xlim=[0,80],ylim=[0.50,1],title='loss')
    # read_oneCol_byName(filepath,sheer_name,clo_name)
    # read_Cols_byColName(filepath,sheer_name1,clo_names,1) # 'BCE'
    # plt.plot(get_Var['epoch'],get_Var['Dice'],linestyle='--')
    #
    # read_Cols_byColName(filepath,sheer_name2,clo_names,1,80) # 'Dice'
    # plt.plot(get_Var['epoch'], get_Var['Dice'],linestyle='--')

    read_Cols_byColName(filepath,sheer_name1,clo_names,1) # 'BCE'
    plt.plot(get_Var['epoch'],get_Var['Dice'])

    read_Cols_byColName(filepath,sheer_name2,clo_names,1,80) # 'Dice'
    plt.plot(get_Var['epoch'], get_Var['Dice'])

    read_Cols_byColName(filepath,sheer_name6,clo_names,1)  # '0.25BCE+Dice'
    plt.plot(get_Var['Dice'])

    read_Cols_byColName(filepath,sheer_name4,clo_names,1) # '0.5BCE+Dice'
    plt.plot(get_Var['Dice'])

    # read_Cols_byColName(filepath,sheer_name3,clo_names,1) # 'BCE+Dice'
    # plt.plot(get_Var['Dice'],color='b')
    #
    # read_Cols_byColName(filepath,sheer_name7,clo_names,1)  # '2BCE+Dice'
    # plt.plot(get_Var['Dice'],color='gray')

    # read_Cols_byColName(filepath,sheer_name5,clo_names,1)  # '2BCE+Dice'
    # plt.plot(get_Var['Dice'],color='m')
    read_Cols_byColName(filepath,sheer_name3,clo_names,1) # 'BCE+Dice'
    plt.plot(get_Var['Dice'],color='cyan')
    #
    read_Cols_byColName(filepath,sheer_name7,clo_names,1)  # '2BCE+Dice'
    plt.plot(get_Var['Dice'])


    read_Cols_byColName(filepath,sheer_name5,clo_names,1)  # '2BCE+Dice'
    plt.plot(get_Var['Dice'])


    plt.legend(['BCE','DL','0.25BCE+DL','0.5BCE+DL','BCE+DL','1.5BCE+DL','2BCE+DL'])
    # plt.title('Validation Dice for different coefficient of hybrid loss ')
    plt.xlabel('Epoch',fontsize=11)
    plt.ylabel('F1-score',fontsize=11)


    # 从全局变量中将值都取出来
    epoch=get_Var['epoch']
    Dice=get_Var['Dice']

    plt.savefig('Dice.jpg')
    plt.show()