R语言假设检验完整入门教程
本文介绍假设检验的概念,以及如何实现T检验。包括单样本T检验、双样本T检验以及配对样本T检验。
假设检验
假设检验(hypothesis testing),又称统计假设检验,是用来判断样本与样本、样本与总体的差异是由抽样误差引起还是本质差别造成的统计推断方法。
R语言提供t.test()函数执行不同类型T检验,语法如下:
# y为null 为单样本T检验
t.test(x, y = NULL,
alternative = c(“two.sided”, “less”, “greater”),
mu = 0, paired = FALSE, var.equal = FALSE,
conf.level = 0.95, …)
- x, y: 两个样本数据.
- alternative: 检验的备择假设.
- mu: 假设的总体均值.
- paired: 是否执行配对检验.
- var.equal: 是否假设两个样本方差相等.
- conf.level: 要使用的置信度.
下面通过示例来说明如何使用该函数。
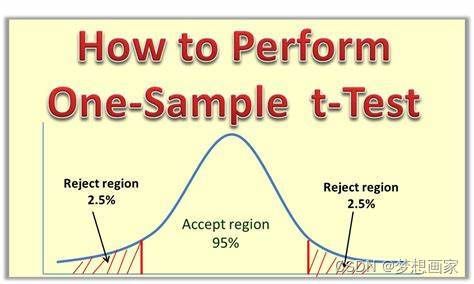
单样本T检验
它用来检验总体均值是否等于某值。举例,如果我们想知道某种类型海龟平均重量是否为310磅,为此收集一些随机样本,样本海龟重量如下:
随机样本重量:300, 315, 320, 311, 314, 309, 300, 308, 305, 303, 305, 301, 303
下面代码执行单样本T检验:
# 定义样本向量
turtle_weights <- c(300, 315, 320, 311, 314, 309, 300, 308, 305, 303, 305, 301, 303)

# 执行单样本T检验
t.test(x = turtle_weights, mu = 310)

# 	One Sample t-test
#
# data:  turtle_weights
# t = -1.5848, df = 12, p-value = 0.139
# alternative hypothesis: true mean is not equal to 310
# 95 percent confidence interval:
#  303.4236 311.0379
# sample estimates:
# mean of x
#  307.2308
从输出可以看到:
因为p值为0.139,不小于.05, 我们不能拒绝原假设。这意味着我们没有足够证据说明这种类型海龟平均重量不等于310磅。
双样本T检验
双样本T检验用于测试两个总体均值是否相等。举例,我们想知道两个不同种类海龟平均重量是否相等,为此,随机收集两种海龟样本,重量如下:
样本1: 300, 315, 320, 311, 314, 309, 300, 308, 305, 303, 305, 301, 303
样本2: 335, 329, 322, 321, 324, 319, 304, 308, 305, 311, 307, 300, 305
下面代码实现双样本T检验:
# 两种海龟样本重量向量
sample1 <- c(300, 315, 320, 311, 314, 309, 300, 308, 305, 303, 305, 301, 303)
sample2 <- c(335, 329, 322, 321, 324, 319, 304, 308, 305, 311, 307, 300, 305)

# 执行双样本T检验
t.test(x = sample1, y = sample2)

# 	Welch Two Sample t-test
#
# data:  sample1 and sample2
# t = -2.1009, df = 19.112, p-value = 0.04914
# alternative hypothesis: true difference in means is not equal to 0
# 95 percent confidence interval:
#  -14.73862953  -0.03060124
# sample estimates:
# mean of x mean of y
#  307.2308  314.6154
从输出可以看到:
T检验统计量: -2.1009
自由度 : 19.112
p值 : 0.04914
95%置信区间: [-14.74, -0.03]
样本1平均重量 : 307.2308
样本1平均重量 : 314.6154
因为p值为0.04914,小于.05, 我们拒绝原假设。这意味着我们有足够证据说明这俩种类型海龟平均重量不相等。
配对样本T检验
当一个样本中的每个观测值可以与另一个样本中的观测值配对时,我们可以使用配对样本t检验来比较两个样本的均值。
例如,假设我们想知道某种训练程序是否能够增加篮球运动员的最大垂直跳跃高度(以英寸为单位)。为了验证这一点,我们随机招募12名大学生篮球运动员,并测量他们每个人的最大垂直跳跃。然后让每个运动员按照新的训练程序训练一个月,然后在月底再次测量他们的最大垂直跳跃高度。
以下数据显示了每个运动员在使用训练程序之前和之后的最大跳跃高度(英寸):
Before: 22, 24, 20, 19, 19, 20, 22, 25, 24, 23, 22, 21
After: 23, 25, 20, 24, 18, 22, 23, 28, 24, 25, 24, 20
下面代码执行配对样本检验:
# 最大跳跃高度统计向量
before <- c(22, 24, 20, 19, 19, 20, 22, 25, 24, 23, 22, 21)
after <- c(23, 25, 20, 24, 18, 22, 23, 28, 24, 25, 24, 20)

# 执行配对样本检验
t.test(x = before, y = after, paired = TRUE)

# 	Paired t-test
#
# data:  before and after
# t = -2.5289, df = 11, p-value = 0.02803
# alternative hypothesis: true difference in means is not equal to 0
# 95 percent confidence interval:
#  -2.3379151 -0.1620849
# sample estimates:
# mean of the differences
#                   -1.25
从输出可以看到:
T检验统计量 : -2.5289
自由度 : 11
p值 : 0.02803
95%置信区间 : [-2.34, -0.16]
两者均值差 : -1.25
因为p值为0.02803,小于.05, 我们拒绝原假设。这意味着我们有足够证据说明按照新训练程序前后最大跳跃高度不相等。
