线性回归 (Linear Regression)
机器学习笔记——总贴
本文目录
-
-
- 1. 线性回归
-
- 1.1 引言
- 1.2 线性回归的假设 (hypothesis)
- 1.3 代价函数 (cost function)
- 1.4 梯度 (gradient)
- 1.5 批梯度下降 (batch gradient descent)
- 1.6 随机梯度下降 (stochastic gradient descent)
- 1.7 关于梯度下降算法的更多讨论
- 1.8 最小二乘法 (least squares)
- 2. 线性回归实例——预测波士顿的房价
-
- 2.1 波士顿房价数据集
- 2.2 批梯度下降算法的实现
- 2.3 随机梯度下降算法的实现
- 2.4 最小二乘法的实现
- 2.5 使用 scikit-learn 实现
- 2.6 完整代码
- 3. 参考材料
-
1. 线性回归
1.1 引言
给定数据集 { ( x 1 , y 1 ) , ( x 2 , y 2 ) , ⋯ , ( x n , y n ) } \{(x_1,y_1),(x_2,y_2),\cdots,(x_n,y_n)\} {(x1,y1),(x2,y2),⋯,(xn,yn)},线性回归试图学得一个线性模型以尽可能准确地预测实值输出标记。其中,我们称该数据集中的 x i x_i xi 为输入(特征), y i y_i yi 为输出(标记)。下面的波士顿房价数据集[1]就是一个简单的例子:
| 面积(平方英尺) | 卧室数量 | 价格(千美元) |
|---|---|---|
| 2104 | 3 | 400 |
| 1416 | 2 | 232 |
| 1534 | 2 | 315 |
| 852 | 1 | 178 |
在这个例子中,每一个输入拥有两个特征:面积与卧室数量, x 1 = [ 2104 , 3 ] T x_1 = [2104, 3]^T x1=[2104,3]T, x 2 = [ 1416 , 2 ] T x_2 = [1416,2]^T x2=[1416,2]T, ⋯ \cdots ⋯;输出为房屋价格, y 1 = 400 y_1 = 400 y1=400, y 2 = 232 y_2 = 232 y2=232, ⋯ \cdots ⋯
另外,我们在此约定另外几个符号:
- m m m:数据集中有 m m m 组数据,即训练数据的个数;
- n n n:特征的数量,也即向量 x i x_i xi 的维数;
- θ \theta θ:我们需要学习的模型中的参数,它的意义是每一个特征在影响输出时的权重;
- ( x , y ) (x,y) (x,y):训练数据集;
- ( x ( i ) , y ( i ) ) \left(x^{(i)},y^{(i)}\right) (x(i),y(i)):第 i i i 组训练数据。
1.2 线性回归的假设 (hypothesis)
线性回归试图学得一个由输入的各个特征的线性组合表示的模型来尽可能准确地预测实值输出标记:
h θ ( x ) = θ o + θ 1 x 1 + ⋯ + θ n x n (1) h_{\theta}(x) = \theta_o + \theta_1x_1 + \cdots + \theta_nx_n \tag{1} hθ(x)=θo+θ1x1+⋯+θnxn(1)
其中 θ = [ θ 0 , θ 1 , ⋯ , θ n ] T \theta = [\theta_0, \theta_1, \cdots, \theta_n]^T θ=[θ0,θ1,⋯,θn]T, h θ ( x ) h_{\theta}(x) hθ(x) 为假设的记号。我们的目标就是找到一组 θ \theta θ 值,使得 h θ ( x ) h_{\theta}(x) hθ(x) 的值尽可能接近实际的输出值 y y y。
1.3 代价函数 (cost function)
代价函数,有时也被称为平方误差函数、平方误差代价函数(实际上是两种最常用的代价函数)。在实际问题中,我们想要尽量的减少预测值和实际值的平方差,即使得平方误差代价函数的值最小。
前面我们说到,我们希望让 h θ ( x ) h_{\theta}(x) hθ(x) 的值尽可能接近实际的输出值 y y y,即让 ( h θ ( x ) − y ) 2 \left(h_{\theta}(x) - y\right)^2 (hθ(x)−y)2 的值尽可能小。现在我们来定义这个问题的代价函数:
J ( θ ) = 1 2 ∑ i = 1 m ( h θ ( x ( i ) ) − y ( i ) ) 2 (2) J(\theta) = \frac{1}{2}\sum_{i=1}^m\left(h_{\theta}(x^{(i)}) - y^{(i)}\right)^2 \tag{2} J(θ)=21i=1∑m(hθ(x(i))−y(i))2(2)
现在我们的目标转化为了找到一组 θ \theta θ 的值,使得 J ( θ ) J(\theta) J(θ) 的值最小。
1.4 梯度 (gradient)
梯度是微积分中非常重要的一个概念,要进行后续的学习,我们首先需要回顾这个非常重要的概念。
给定一个函数和函数上的一个点,该点的梯度方向为该函数在该点处方向导数最大的方向,即函数值上升最快的方向;而该点梯度的反方向为函数值下降最快的方向。如下图[2]所示,对于函数 f ( x , y ) = x 2 2 + y 2 2 f(x,y) = \frac{x^2}{2}+\frac{y^2}{2} f(x,y)=2x2+2y2 来说,它在点 ( 1 , 1 ) (1,1) (1,1) 处的梯度方向为红色箭头所示方向,这也是函数在该点处函数值上升最快的方向,而蓝色箭头给出了梯度的反方向,即函数值下降最快的方向。

1.5 批梯度下降 (batch gradient descent)
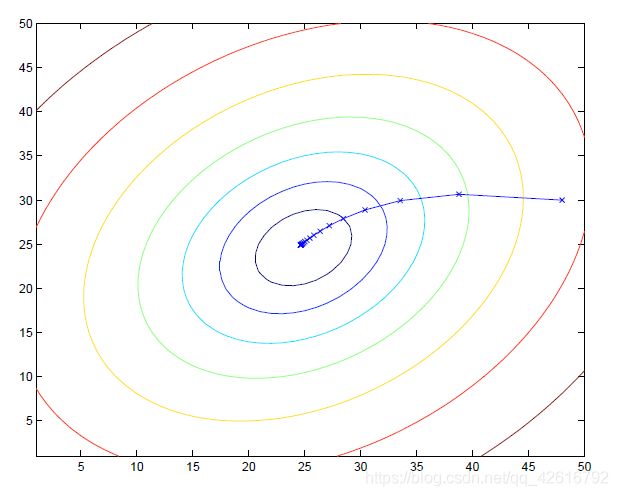
现在我们回到上面波士顿房价的例子来看看什么是批梯度下降。上面我们已经回顾了梯度的概念,那么在梯度下降算法中,我们首先将参数初始化,在线性回归中,通常我们将其初始化为零向量(即 θ = [ 0 , 0 , ⋯ , 0 ] T \theta = [0, 0,\cdots,0]^T θ=[0,0,⋯,0]T,当然你也可以不这么做)。然后我们需要不断的更新参数的值,直到代价函数收敛到局部最小值(在线性回归中为全局最小值)。其中更新规则为:
θ j : = θ j − α ∂ ∂ θ j J ( θ ) (3) \theta_j := \theta_j - \alpha \frac{\partial}{\partial\theta_j}J(\theta) \tag{3} θj:=θj−α∂θj∂J(θ)(3)
其中 ‘:=’ 表示赋值; α \alpha α 为学习率,它会影响算法的收敛速度以及效果(后面会讨论,我们可以暂且理解为它决定在每一步中我们沿当前梯度的反方向前进多少)。
当 α \alpha α 太大时,梯度下降算法会在最优值附近来回振荡而无法收敛(实际中的一个小经验:当我们发现 J ( θ ) J(\theta) J(θ) 的值不降反增时,往往是 α \alpha α 的值大了);当 α \alpha α 太小时,梯度下降算法收敛到最优值所需要的迭代步骤会过多,导致训练速度非常慢。因此,选择合适的 α \alpha α 值是非常重要的,在实际中,我们需要不断调整 α \alpha α 的值来观察学习算法的表现,最终选择一个合适的 α \alpha α 的值。
现在我们来对式 (3) 进行进一步的讨论。首先假设我们只有一组训练数据,那么
∂ ∂ θ j J ( θ ) = ∂ ∂ θ j 1 2 ( h θ ( x ) − y ) 2 = ( h θ ( x ) − y ) ∂ ∂ θ j ( h θ ( x ) − y ) = ( h θ ( x ) − y ) ∂ ∂ θ j ( θ 0 + θ 1 x 1 + ⋯ + θ n x n − y ) = ( h θ ( x ) − y ) x j (4) \begin{aligned} \frac{\partial}{\partial\theta_j}J(\theta) &= \frac{\partial}{\partial\theta_j}\frac{1}{2}\left(h_{\theta}(x)-y\right)^2\\ &= \left(h_{\theta}(x)-y\right)\frac{\partial}{\partial\theta_j}\left(h_{\theta}(x)-y\right)\\ &= \left(h_{\theta}(x)-y\right)\frac{\partial}{\partial\theta_j}\left(\theta_0+\theta_1x_1 + \cdots + \theta_nx_n-y\right)\\ &= \left(h_{\theta}(x)-y\right)x_j \end{aligned} \tag{4} ∂θj∂J(θ)=∂θj∂21(hθ(x)−y)2=(hθ(x)−y)∂θj∂(hθ(x)−y)=(hθ(x)−y)∂θj∂(θ0+θ1x1+⋯+θnxn−y)=(hθ(x)−y)xj(4)
对于 m m m 组训练数据,有:
θ j : = θ j − α ∑ i = 1 m ( h θ ( x ( i ) ) − y ( i ) ) x j ( i ) (5) \theta_j := \theta_j - \alpha\sum_{i=1}^m\left(h_{\theta}(x^{(i)})-y^{(i)}\right)x_j^{(i)} \tag{5} θj:=θj−αi=1∑m(hθ(x(i))−y(i))xj(i)(5)
批梯度下降算法的优点:
- 由所有数据确定的方向能够更好地代表样本总体,从而在每一步迭代过程中,算法可以更准确地朝向极值所在的方向收敛。当代价函数为凸函数时,批梯度下降一定能够收敛到全局最优解(在线性回归中,批梯度下降算法一定可以收敛到全局最优解)。
批梯度下降算法的缺点:
- 当样本数 m m m 非常大时,利用批梯度下降算法进行训练将会变得非常慢。
1.6 随机梯度下降 (stochastic gradient descent)
不同于批梯度下降,随机梯度下降在每次仅选择一个以组训练数据进行参数迭代:
Loop : For j = 1 to m : θ j : = θ j − α ( h θ ( x ( i ) ) − y ( i ) ) x j ( i ) End For End Lo op \begin{aligned} \text{Loop : }& \\ \text{For }&\text{j = 1 to m :} \\ &\theta_j := \theta_j - \alpha\left(h_{\theta}(x^{(i)})-y^{(i)}\right)x_j^{(i)} \\ \text{End}&\text{ For} \\ \text{End Lo}&\text{op} \end{aligned} Loop : For EndEnd Loj = 1 to m :θj:=θj−α(hθ(x(i))−y(i))xj(i) Forop
随机梯度下降算法的优点:
- 相对于批梯度下降,计算消耗大大变少。
随机梯度下降算法的缺点:
- 算法不会收敛到局部最优,随着迭代次数的增加,其最终只会在最优值附近震荡。
1.7 关于梯度下降算法的更多讨论
- 尽管随机梯度下降得到的解并不是全局最优,但事实证明他们通常工作得很好;
- 在实际中,随机梯度下降比批梯度下降使用得更多;
- 在实际使用随机梯度下降时,学习率会被设置为越来越小,这样得到的结果往往更接近全局最优;
- 在实际中,还有一种在批梯度下降和随机梯度下降之间进行折中的算法——小批量梯度下降,它在每次迭代过程中会使用一定数量的小部分样本进行参数更新。
1.8 最小二乘法 (least squares)
首先我们引入一些记号:
X = [ x ( 1 ) T ⋮ x ( m ) T ] y = [ y ( 1 ) ⋮ y ( m ) ] θ = [ θ 0 ⋮ θ n ] \begin{aligned} X = \begin{bmatrix} x^{(1)^T} \\ \vdots \\ x^{(m)^T} \end{bmatrix} \quad y = \begin{bmatrix} y^{(1)} \\ \vdots \\ y^{(m)} \end{bmatrix} \quad \theta = \begin{bmatrix} \theta_0 \\ \vdots \\ \theta_n \end{bmatrix} \end{aligned} X=⎣⎢⎡x(1)T⋮x(m)T⎦⎥⎤y=⎣⎢⎡y(1)⋮y(m)⎦⎥⎤θ=⎣⎢⎡θ0⋮θn⎦⎥⎤
同时我们定义:
∇ A f ( A ) = [ ∂ f ∂ A 11 ⋯ ∂ f ∂ A 1 n ⋮ ⋱ ⋮ ∂ f ∂ A m 1 ⋯ ∂ f ∂ A m n ] \nabla_Af(A) = \begin{bmatrix} \frac{\partial f}{\partial A_{11}} & \cdots & \frac{\partial f}{\partial A_{1n}} \\ \vdots & \ddots & \vdots \\ \frac{\partial f}{\partial A_{m1}} & \cdots & \frac{\partial f}{\partial A_{mn}} \end{bmatrix} ∇Af(A)=⎣⎢⎡∂A11∂f⋮∂Am1∂f⋯⋱⋯∂A1n∂f⋮∂Amn∂f⎦⎥⎤
那么我们有:
∇ θ J ( θ ) = ∇ θ 1 2 ( X θ − y ) T ( X θ − y ) = ∇ θ 1 2 ( θ T X T X θ − θ T X T y − y T X θ + y T y ) = X T X θ − X T θ \begin{aligned} \nabla_{\theta}J(\theta) &= \nabla_{\theta}\frac{1}{2}\left(X\theta-y\right)^T\left(X\theta-y\right) \\ &= \nabla_{\theta}\frac{1}{2}\left(\theta^TX^TX\theta-\theta^TX^Ty-y^TX\theta+y^Ty\right) \\ &= X^TX\theta-X^T\theta \end{aligned} ∇θJ(θ)=∇θ21(Xθ−y)T(Xθ−y)=∇θ21(θTXTXθ−θTXTy−yTXθ+yTy)=XTXθ−XTθ
令 ∇ θ J ( θ ) = 0 \nabla_{\theta}J(\theta) = 0 ∇θJ(θ)=0,我们就得到了正规方程 (Normal equation):
X T X θ = X T y (6) X^TX\theta = X^Ty \tag{6} XTXθ=XTy(6)
由正规方程,我们即可以解出我们需要的参数值:
θ = ( X T X ) − 1 X T y (7) \theta = \left(X^TX\right)^{-1}X^Ty \tag{7} θ=(XTX)−1XTy(7)
注意:式 (7) 有唯一解的条件为 X T X X^TX XTX 为满秩矩阵或正定矩阵,当 X T X X^TX XTX 不满秩时,我们需要考虑一下两个因素:
- 在数据集中,各个特征不是线性无关的,即存在线性相关的特征;
- 特征数目太多,而样本数目较少,使得特征数目甚至超过样例数,从而导致 X X X 的行数多于列数,此时 X T X X^TX XTX 显然不满秩。
这时我们常见的作法是引入正则化项(此处不做讨论)。
2. 线性回归实例——预测波士顿的房价
2.1 波士顿房价数据集
scikit-learn 中自带了一些可以让大家入门机器学习的数据集,这里我们要使用的是波士顿房价的数据集[3]。在这个数据集中,影响房价的有如下13个因素:
- 人均犯罪率
- 住宅用地超过两万五千平方英尺的比例
- 城镇的非零售营业比例
- 河流分界
- 一氧化碳浓度
- 平均住宅房间数
- 1940 年之前建造的房屋业主比例
- 距离波士顿五个就业中心的加权距离
- 径向公路的可达指数
- 每一万美元财产的全额财产税率
- 城乡教师比例
- 黑人比例
- 底层人群比例
而输出为房屋价值的中值。如果我们已经安装了 scikit-learn,那么可以直接读取这个数据集:
from sklearn.datasets import load_boston
boston = load_boston()
data = pd.DataFrame(boston.data, columns=boston.feature_names)
data['value'] = boston.target
print(data.head())
2.2 批梯度下降算法的实现
要实现批梯度下降算法,我们先对式 (5) 做一些小处理,即将所有的参数更新规则写在一起:
[ θ 0 ⋮ θ n ] : = [ θ 0 ⋮ θ n ] − α [ x 0 ( 0 ) ⋯ x 0 ( m ) ⋮ ⋱ ⋮ x n ( 0 ) ⋯ x n ( m ) ] [ θ T x ( 0 ) − y ( 0 ) ⋮ θ T x ( m ) − y ( m ) ] (8) \begin{bmatrix} \theta_0 \\ \vdots \\ \theta_n \end{bmatrix} := \begin{bmatrix} \theta_0 \\ \vdots \\ \theta_n \end{bmatrix} -\alpha\begin{bmatrix} x_0^{(0)} & \cdots & x_0^{(m)} \\ \vdots & \ddots & \vdots \\ x_n^{(0)} & \cdots & x_n^{(m)} \end{bmatrix} \begin{bmatrix} \theta^Tx^{(0)}-y^{(0)} \\ \vdots \\ \theta^Tx^{(m)}-y^{(m)} \end{bmatrix} \tag{8} ⎣⎢⎡θ0⋮θn⎦⎥⎤:=⎣⎢⎡θ0⋮θn⎦⎥⎤−α⎣⎢⎢⎡x0(0)⋮xn(0)⋯⋱⋯x0(m)⋮xn(m)⎦⎥⎥⎤⎣⎢⎡θTx(0)−y(0)⋮θTx(m)−y(m)⎦⎥⎤(8)
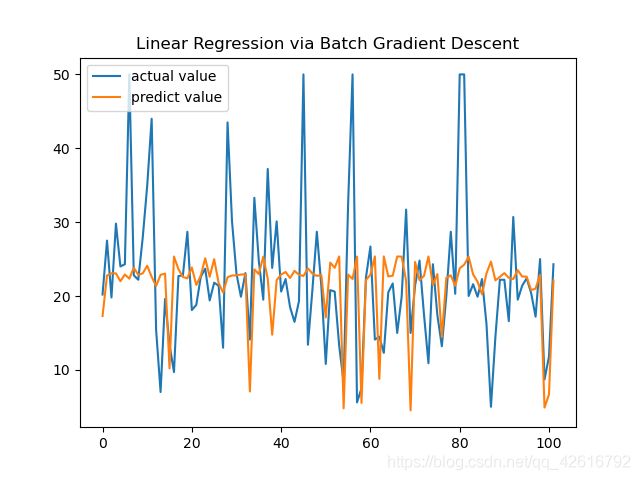
式 (8) 可以简记为:
θ : = θ − α X T ( X θ − y ) (9) \theta := \theta - \alpha X^T(X\theta-y) \tag{9} θ:=θ−αXT(Xθ−y)(9)
现在我们就可以利用式 (9) 来实现批梯度下降了。
def batchGradientDescent(X, Y, theta, alpha, max_iteration):
    for i in range (0, max_iteration):
        theta = theta - alpha * np.dot(X.T, np.dot(X, theta) - Y)
        # theta = theta - alpha * np.dot(np.dot(X, theta) - Y, X)
    return theta

theta0 = np.zeros(13)
theta = batchGradientDescent(x_train, y_train, theta0, 0.0000000001, 1500)
y_predict = np.dot(x_test, theta.T)
2.3 随机梯度下降算法的实现
随机梯度下降算法的实现类似于批梯度下降算法:
def stochasticGradientDescent(X, Y, theta, alpha, max_iteration):
    for i in range (0, max_iteration):
        rand_index = random.randint(0, X.shape[0]-1)
        x_rand = X[rand_index]
        theta = theta - alpha * np.dot(x_rand, np.dot(theta, x_rand) - Y[rand_index])
    return theta

theta0 = np.zeros(13)
theta = stochasticGradientDescent(x_train, y_train, theta0, 0.000000001, 100000)
y_predict = np.dot(x_test, theta.T)
2.4 最小二乘法的实现
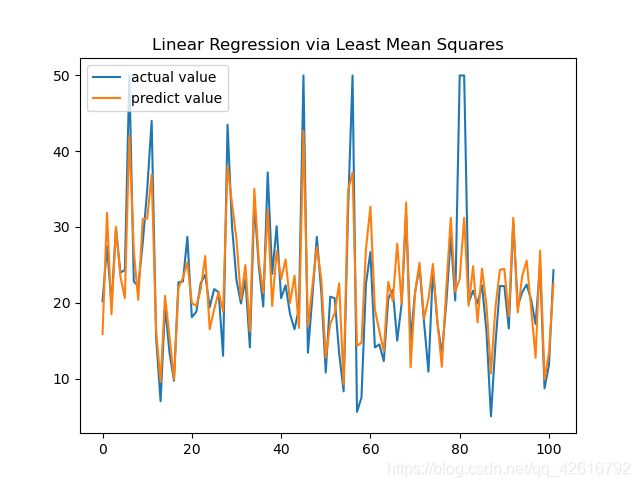
我们直接利用式 (7) 即可实现最小二乘法:
def leastMeanSquares(X, Y):
    return np.dot(np.dot(np.linalg.inv(np.dot(X.T, X)), X.T), Y)

def predict(X_test, paras):
    return np.dot(X_test, paras.T)

theta = leastMeanSquares(x_train, y_train)
y_predict = predict(x_test, theta)
2.5 使用 scikit-learn 实现
scikit-learn 的官方文档[4]对如何使用 scikit-learn 构建线性回归模型给出了详细的说明,大家可以直接查看官方文档说明,下面是利用 scikit-learn 进行波士顿房价预测的代码:
sklearn_linear_model = LinearRegression()
sklearn_linear_model.fit(x_train, y_train)
y_predict = sklearn_linear_model.predict(x_test)
2.6 完整代码
'''
@ LinearRegression.py
@ Author: Hans
@ Date: 2020/09/10
'''
from sklearn.datasets import load_boston
from sklearn.model_selection import train_test_split
from sklearn.linear_model import LinearRegression
import pandas as pd
import numpy as np
import matplotlib.pyplot as plt
import random

'''
@ dimension of this dataset:
506 * (13 + 1)

@ features (input) of this dataset:
1.  CRIM per capita crime rate by town
2.  ZN proportion of residential land zoned for lots over 25,000 sq.ft.
3.  INDUS proportion of non-retail business acres per town
4.  CHAS Charles River dummy variable (= 1 if tract bounds river; 0 otherwise)
5.  NOX nitric oxides concentration (parts per 10 million)
6.  RM average number of rooms per dwelling
7.  AGE proportion of owner-occupied units built prior to 1940
8.  DIS weighted distances to five Boston employment centres
9.  RAD index of accessibility to radial highways
10. TAX full-value property-tax rate per $10,000
11. PTRATIO pupil-teacher ratio by town
12. B 1000(Bk - 0.63)^2 where Bk is the proportion of blacks by town
13. LSTAT % lower status of the population

@ output of this dataset:
MEDV Median value of owner-occupied homes in $1000’s
'''
boston = load_boston()
data = pd.DataFrame(boston.data, columns=boston.feature_names)
data['value'] = boston.target

x_train, x_test, y_train, y_test = train_test_split(boston.data, boston.target, test_size = 0.2)

## implement linear regression via batch gradient descent
def batchGradientDescent(X, Y, theta, alpha, max_iteration):
    for i in range (0, max_iteration):
        theta = theta - alpha * np.dot(X.T, np.dot(X, theta) - Y)
        # theta = theta - alpha * np.dot(np.dot(X, theta) - Y, X)
    return theta

theta0 = np.zeros(13)
theta = batchGradientDescent(x_train, y_train, theta0, 0.0000000001, 1500)
y_predict = np.dot(x_test, theta.T)

plt.plot(y_test, label = 'actual value')
plt.plot(y_predict, label = 'predict value')
plt.legend()
plt.title('Linear Regression via Batch Gradient Descent')
plt.show()

## implement linear regression via stochastic gradient descent
def stochasticGradientDescent(X, Y, theta, alpha, max_iteration):
    for i in range (0, max_iteration):
        rand_index = random.randint(0, X.shape[0]-1)
        x_rand = X[rand_index]
        theta = theta - alpha * np.dot(x_rand, np.dot(theta, x_rand) - Y[rand_index])
    return theta

theta0 = np.zeros(13)
theta = stochasticGradientDescent(x_train, y_train, theta0, 0.000000001, 100000)
y_predict = np.dot(x_test, theta.T)

plt.plot(y_test, label = 'actual value')
plt.plot(y_predict, label = 'predict value')
plt.legend()
plt.title('Linear Regression via Batch Gradient Descent')
plt.show()

## implement linear regression via least mean squares
def leastMeanSquares(X, Y):
    return np.dot(np.dot(np.linalg.inv(np.dot(X.T, X)), X.T), Y)

def predict(X_test, paras):
    return np.dot(X_test, paras.T)

theta = leastMeanSquares(x_train, y_train)
y_predict = predict(x_test, theta)

plt.plot(y_test, label = 'actual value')
plt.plot(y_predict, label = 'predict value')
plt.legend()
plt.title('Linear Regression via Least Mean Squares')
plt.show()

## implement linear regression via scikit-learn package
sklearn_linear_model = LinearRegression()
sklearn_linear_model.fit(x_train, y_train)
y_predict = sklearn_linear_model.predict(x_test)

plt.plot(y_test, label = 'actual value')
plt.plot(y_predict, label = 'predict value')
plt.title('Linear Regression via scikit-learn package')
plt.legend()
plt.show()
3. 参考材料
[1] Andrew Ng, Lecture notes, CS229, Stanford.
[2] Thomas, G. B., Weir, M. D., Hass, J., Giordano, F. R., & Korkmaz, R. (2010). Thomas’ calculus. Boston: Pearson.
[3] https://scikit-learn.org/stable/modules/generated/sklearn.datasets.load_boston.html
[4] https://scikit-learn.org/stable/modules/generated/sklearn.linear_model.LinearRegression.html


