numpy.meshgrid()理解!以及列子说明,代码实现!详细,一看就懂,清晰易懂!!!!
文章目录
- 前言
- 一、meshgrid功能 : 生成指定的矩阵
- 二、生成的矩阵的行数与列数与什么有关?
- 三、 有什么作用?
前言
numpy.meshgrid对于画三维图,和多分类图特别有用。
一、meshgrid功能 : 生成指定的矩阵
import numpy as np

x = np.arange(-2, 2, 0.5)
#[-2.  -1.5 -1.  -0.5  0.   0.5  1.   1.5]
y = np.arange(-2, 2, 0.5)
#[-2.  -1.5 -1.  -0.5  0.   0.5  1.   1.5]
xx, yy = np.meshgrid(x, y)

#xx:
#[[-2.  -1.5 -1.  -0.5  0.   0.5  1.   1.5]
# [-2.  -1.5 -1.  -0.5  0.   0.5  1.   1.5]
# [-2.  -1.5 -1.  -0.5  0.   0.5  1.   1.5]
# [-2.  -1.5 -1.  -0.5  0.   0.5  1.   1.5]
# [-2.  -1.5 -1.  -0.5  0.   0.5  1.   1.5]
# [-2.  -1.5 -1.  -0.5  0.   0.5  1.   1.5]
# [-2.  -1.5 -1.  -0.5  0.   0.5  1.   1.5]
# [-2.  -1.5 -1.  -0.5  0.   0.5  1.   1.5]]


#yy:
#[[-2.  -2.  -2.  -2.  -2.  -2.  -2.  -2. ]
# [-1.5 -1.5 -1.5 -1.5 -1.5 -1.5 -1.5 -1.5]
# [-1.  -1.  -1.  -1.  -1.  -1.  -1.  -1. ]
# [-0.5 -0.5 -0.5 -0.5 -0.5 -0.5 -0.5 -0.5]
# [ 0.   0.   0.   0.   0.   0.   0.   0. ]
# [ 0.5  0.5  0.5  0.5  0.5  0.5  0.5  0.5]
# [ 1.   1.   1.   1.   1.   1.   1.   1. ]
# [ 1.5  1.5  1.5  1.5  1.5  1.5  1.5  1.5]]
二、生成的矩阵的行数与列数与什么有关?
行数由y的列数决定
列数由x的列数决定
import numpy as np

x = np.arange(-2, 2, 0.5)
#[-2.  -1.5 -1.  -0.5  0.   0.5  1.   1.5]
y = np.arange(-2, 2, 0.5)
#[-2.  -1.5 -1.  -0.5  0.   0.5  1.   1.5]
xx, yy = np.meshgrid(x, y)

print(xx.shape)
print(yy.shape)
#输出:
#(8, 8)
#(8, 8)
改变y的大小:
import numpy as np

x = np.arange(-2, 2, 0.5)
#[-2.  -1.5 -1.  -0.5  0.   0.5  1.   1.5]
y = np.arange(-1, 1, 0.5)
#[-1.  -0.5  0.   0.5]
xx, yy = np.meshgrid(x, y)
print(xx.shape)
print(yy.shape)
#输出:
#(4, 8)
#(4, 8)
改变x的大小:
import numpy as np

x = np.arange(-1, 1, 1)
#[-1  0]
y = np.arange(-1, 1, 0.5)
#[-1.  -0.5  0.   0.5]
xx, yy = np.meshgrid(x, y)
print(xx.shape)
print(yy.shape)

#输出:
#(4, 2)
#(4, 2)
三、 有什么作用?
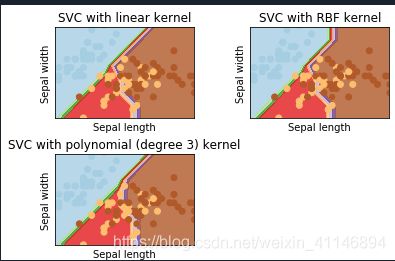
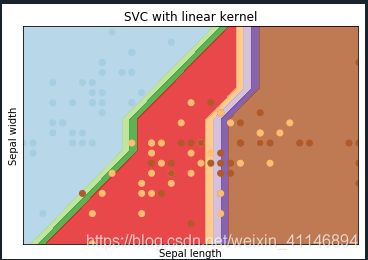
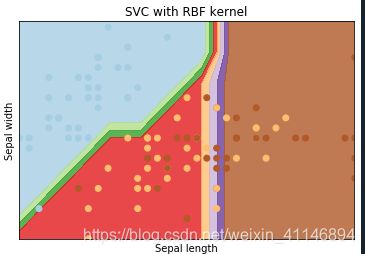
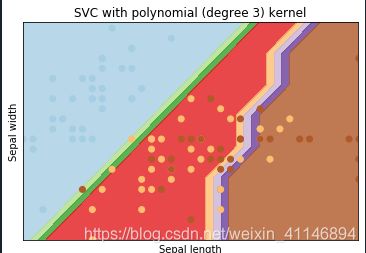
根据矩阵来画图,这里举一个列子,这里是根据机器学习里面的iris数据集来实现分类,你可以直接看画图那一部分的代码,有兴趣也可以看看全部代码,代码有详细的注释,也不难。直接看代码!
import numpy as np
from sklearn import datasets
from sklearn.svm import LinearSVC,SVC
from matplotlib import pyplot as plt
from sklearn.preprocessing import StandardScaler as normalize
from sklearn.model_selection import train_test_split

#数据预处理,标准化
def normalize( x ):
    x_mean = np.mean( x )
    x_std = np.std( x )
    x=(x- x_mean)/x_std
    return x
 #数据的获取
def data_Set_load( ):
    loaded_data=datasets.load_iris()
    x_data,y_data = loaded_data.data[:,0:2],loaded_data.target
    x_data = normalize(x_data)

    x_train ,x_test , y_train, y_test = train_test_split(x_data, y_data, test_size =0.3)
    return x_train ,x_test ,y_train,y_test
#正确个数的计算
def count_num( x, y):
    num = len(x)
    sum_1 = 0
    for i in range( num):
        if x[i] == y[i]:
            sum_1 = sum_1 + 1
    return sum_1

#支持向量机
def svm_function(x_train, y_train, x_test, y_test):

    title_name = {"kernel =linear:","kernel =rbf:","kernel =poly:"}
    #看三种内核的正确率和打分情况
    clf = SVC(C=1, kernel ='linear').fit(x_train, y_train)
    clf_1 = SVC(C=1,kernel = 'rbf').fit(x_train,y_train)
    clf_2 = SVC(C=1,kernel = 'poly').fit(x_train,y_train)

    score_1 = clf.score(x_test,  y_test)
    score_2 = clf_1.score(x_test,  y_test)
    score_3 = clf_2.score(x_test,  y_test)

    result = clf.predict(x_test)
    num = count_num( result, y_test)
    print("kernel =linear:", num/len(y_test),"   score:",score_1)

    result = clf_1.predict(x_test)
    num = count_num( result, y_test)
    print("kernel =rbf:", num/len(y_test),"   score:",score_2)

    result = clf_2.predict(x_test)
    num = count_num( result, y_test)
    print("kernel =poly:", num/len(y_test),"  score:",score_3)


    # 创建网格,以绘制图像
    #根据样本的最大值,最小值来绘制网格的范围
    x_min, x_max = x_train[:, 0].min(), x_train[:, 0].max()
    y_min, y_max = x_train[:, 1].min(), x_train[:, 1].max()
    xx, yy = np.meshgrid(np.arange(x_min, x_max, h),
                         np.arange(y_min, y_max, h))

    # 图的标题
    titles = ['SVC with linear kernel',
              'SVC with RBF kernel',
              'SVC with polynomial (degree 3) kernel']

    #这里使用了枚举,作用是i 是坐标,clf是对应的向量机模型,所以运行了三次
    for i, clf in enumerate((clf, clf_1, clf_2)):
        # 绘出决策边界,不同的区域分配不同的颜色
        plt.subplot(2, 2, i + 1) # 创建一个2行2列的图,并以第i个图为当前图
        plt.subplots_adjust(wspace=0.4, hspace=0.4) # 设置子图间隔
       #.ravel()作用是把矩阵的元素化为一列,这里就把所有的x,y化为了对应了一个坐标
        Z = clf.predict(np.c_[xx.ravel(), yy.ravel()]) #将xx和yy中的元素组成一对对坐标,作为支持向量机的输入,返回一个array(这里是预测值,就是预测的类别)

        # 把分类结果绘制出来
        Z = Z.reshape(xx.shape) #(220, 280),把Z化为对应的矩阵
        plt.contourf(xx, yy, Z, cmap=plt.cm.Paired, alpha=0.8) #使用等高线的函数将不同的区域绘制出来

        # 将训练数据以离散点的形式绘制出来
        plt.scatter(x_train[:, 0], x_train[:, 1], c=y_train, cmap=plt.cm.Paired)
        plt.xlabel('Sepal length')
        plt.ylabel('Sepal width')
        plt.xlim(xx.min(), xx.max())
        plt.ylim(yy.min(), yy.max())
        plt.xticks(())
        plt.yticks(())
        plt.title(titles[i])

    plt.show()


if __name__=="__main__":
    x_train ,x_test , y_train, y_test = data_Set_load()
    svm_function(x_train, y_train, x_test, y_test)


