Deep learning在计算机视觉方面具有广泛的应用,包括图像分类、目标识别、语义分隔、生成图像描述等各个方面。本系列博客将分享自己在这些方面的学习和认识,如有问题,欢迎交流。
在使用卷积神经网络进行分类任务时,往往使用以下几类损失函数:
其中,平方误差损失在分类问题中效果不佳,一般用于回归问题。softmax损失函数和SVM(多分类)损失函数在实际应用中非常广泛。本文将对这两种损失函数做简单介绍,包括损失函数的计算、梯度的求解以及Python中使用Numpy库函数进行实现。
SVM多分类
1. 损失函数
一般而言,深度学习中使用的SVM损失函数是基于 Weston and Watkins 1999 (pdf) 。
其损失函数如下:
Li=∑j≠yimax(0,fj−fyi+Δ)
在实际使用中, Δ 的值一般取1,代表间隔。
在神经网络中,由于我们的评分函数是:
f=W∗x
因此,可以将损失函数改写如下:
Li=∑j≠yimax(0,WTjxi−WTyixi+Δ)
如果考虑整个训练集合上的平均损失,包括正则项,则公式如下:
L=1N∑i∑j≠yi[max(0,f(xi;W)j−f(xi;W)yi+Δ)]+λ∑k∑lW2k,l
直观理解:
多类SVM“想要”正确类别的分类分数比其他不正确分类类别的分数要高,而且至少高出delta的边界值。如果其他分类分数进入了红色的区域,甚至更高,那么就开始计算损失。如果没有这些情况,损失值为0。我们的目标是找到一些权重,它们既能够让训练集中的数据样例满足这些限制,也能让总的损失值尽可能地低。

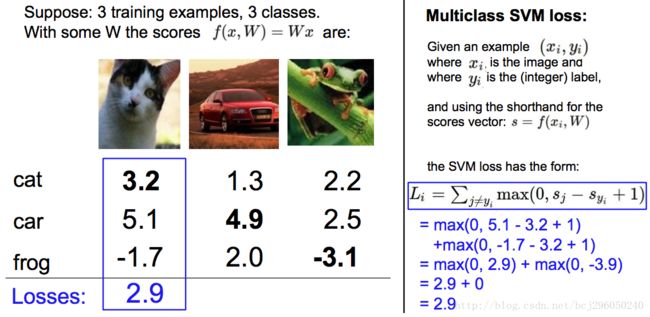
举一个具体的例子:
例子来源于 斯坦福CS231n 课件。第一张图片是猫,神经网络计算得出其三个类别的分值分别为 3.2, 5.1 和 -1.7。很明显,理想情况下猫的分值应该高与其他两种类别,但根据计算结果,car的分值最高,因此在当前的权值设置下,该 network 会把这张图片分类为 car。此时我们可以根据公式计算损失
损失计算如下:(S代表Score,即分值)
Li=max(0,Scar−Scat+Δ)+max(0,Sfrog−Scat+Δ)=2.9+0
2. 梯度公式推导
设置以下变量:
- 矩阵 W 代表权值,维度是 D∗C ,其中 D 代表特征的维度, C 代表类别数目。
- 矩阵 X 代表样本集合,维度是 N∗D , 其中 N 代表样本个数。
- 分值计算公式为 f=X∗W ,其维度为 N∗C , 每行代表一个样本的不同类别的分值。
对于第 i 个样本的损失函数计算如下:
Li=∑j≠yimax(0,WT:,jxi,:−WT:,yixi,:+Δ)
偏导数计算如下:
∂Li∂W:,yi=−(∑j≠yi1(wT:,jxi,:−wT:,yixi,:+Δ>0))xi,:
∂Li∂W:,j=1(wT:,jxi,:−wT:,yixi,:+Δ>0)xi,:
其中:
- w:,j 代表W矩阵第 j 列,其维度为 D 。
- xi,: 代表X矩阵的第 i 行,表示样本 i 的特征,其维度也为 D 。
二者相乘,得出的是样本 i 在第 j 个类别上的得分。
- 1 代表示性函数。
3. python实现
包括向量化版本和非向量化版本:
def svm_loss_naive(W, X, y, reg):
"""
# SVM 损失函数 native版本
Inputs have dimension D, there are C classes, and we operate on minibatches
of N examples.
Inputs:
- W: A numpy array of shape (D, C) containing weights.
- X: A numpy array of shape (N, D) containing a minibatch of data.
- y: A numpy array of shape (N,) containing training labels; y[i] = c means
that X[i] has label c, where 0 <= c < C.
- reg: (float) regularization strength
Returns a tuple of:
- loss as single float
- gradient with respect to weights W; an array of same shape as W
"""
dW = np.zeros(W.shape)
num_classes = W.shape[1]
num_train = X.shape[0]
loss = 0.0
for i in xrange(num_train):
scores = X[i].dot(W)
correct_class_score = scores[y[i]]
for j in xrange(num_classes):
if j == y[i]:
continue
margin = scores[j] - correct_class_score + 1
if margin > 0:
loss += margin
dW[:, y[i]] += -X[i, :]
dW[:, j] += X[i, :]
loss /= num_train
dW /= num_train
loss += 0.5 * reg * np.sum(W * W)
dW += reg * W
return loss, dW
def svm_loss_vectorized(W, X, y, reg):
"""
SVM 损失函数 向量化版本
Structured SVM loss function, vectorized implementation.Inputs and outputs
are the same as svm_loss_naive.
"""
loss = 0.0
dW = np.zeros(W.shape)
scores = X.dot(W)
num_train = X.shape[0]
num_classes = W.shape[1]
scores_correct = scores[np.arange(num_train), y]
scores_correct = np.reshape(scores_correct, (num_train, 1))
margins = scores - scores_correct + 1.0
margins[np.arange(num_train), y] = 0.0
margins[margins <= 0] = 0.0
loss += np.sum(margins) / num_train
loss += 0.5 * reg * np.sum(W * W)
margins[margins > 0] = 1.0
row_sum = np.sum(margins, axis=1)
margins[np.arange(num_train), y] = -row_sum
dW += np.dot(X.T, margins)/num_train + reg * W
return loss, dW
- 1
- 2
- 3
- 4
- 5
- 6
- 7
- 8
- 9
- 10
- 11
- 12
- 13
- 14
- 15
- 16
- 17
- 18
- 19
- 20
- 21
- 22
- 23
- 24
- 25
- 26
- 27
- 28
- 29
- 30
- 31
- 32
- 33
- 34
- 35
- 36
- 37
- 38
- 39
- 40
- 41
- 42
- 43
- 44
- 45
- 46
- 47
- 48
- 49
- 50
- 51
- 52
- 53
- 54
- 55
- 56
- 57
- 58
- 59
- 60
- 61
- 62
- 63
- 64
- 65
- 66
- 67
- 68
- 69
- 70
- 71
- 72
- 73
- 74
- 75
- 76
- 77
- 78
- 79
- 80
- 81
- 82
Softmax 损失函数
1. 损失函数
Softmax 函数是 Logistic 函数的推广,用于多分类。
分值的计算公式不变:
f(xi;W)=W∗x
损失函数使用交叉熵损失函数,第 i 个样本的损失如下:
Li=−log(efyi∑jefj)
其中正确类别得分的概率可以被表示成:
P(yi|xi;W)=efyi∑jefj
在实际使用中, efj 常常因为指数太大而出现数值爆炸问题,两个非常大的数相除会出现数值不稳定问题,因此我们需要在分子和分母中同时进行以下处理:
efyi∑jefj=CefyiC∑jefj=efyi+logC∑jefj+logC
其中 C 的设置是任意的,在实际变成中,往往把 C 设置成:
logC=−maxfj
即第 i 个样本所有分值中最大的值,当现有分值减去该最大分值后结果 ≤0 ,放在 e 的指数上可以保证分子分布都在 0-1之内。
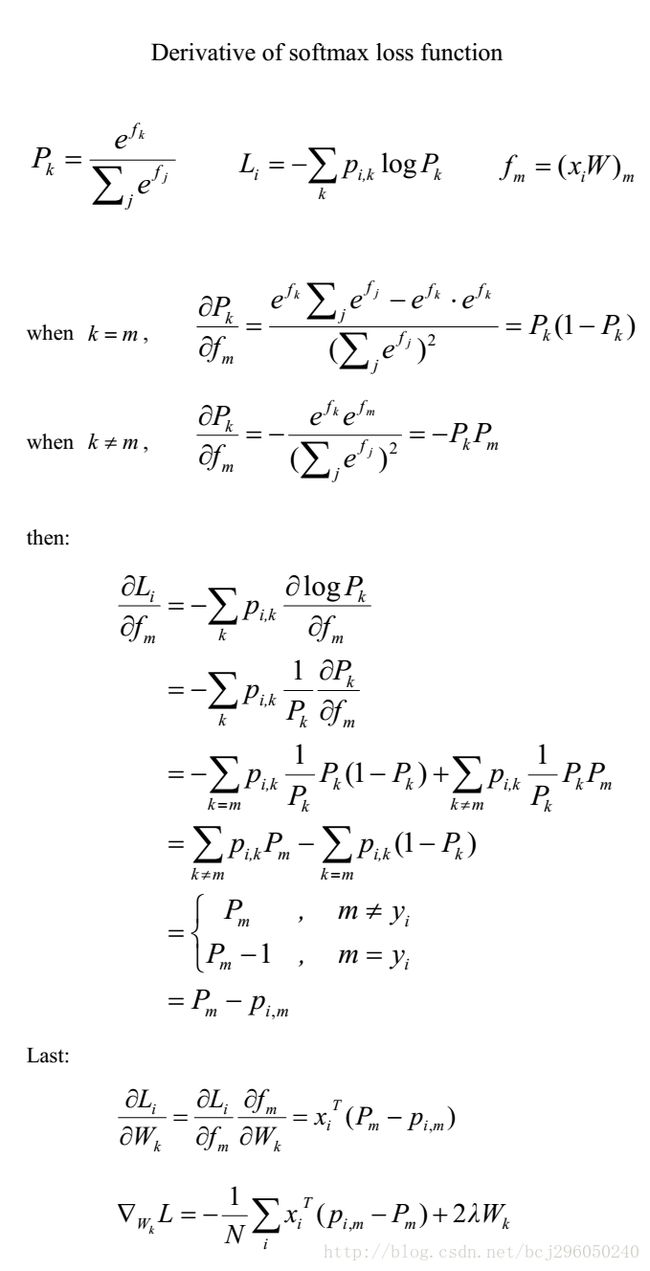
2. 梯度推导
梯度的推导如下:
3. Python实现
def softmax_loss_naive(W, X, y, reg):
"""
Softmax loss function, naive implementation (with loops)
Inputs have dimension D, there are C classes, and we operate on minibatches
of N examples.
Inputs:
- W: A numpy array of shape (D, C) containing weights.
- X: A numpy array of shape (N, D) containing a minibatch of data.
- y: A numpy array of shape (N,) containing training labels; y[i] = c means
that X[i] has label c, where 0 <= c < C.
- reg: (float) regularization strength
Returns a tuple of:
- loss as single float
- gradient with respect to weights W; an array of same shape as W
"""
loss = 0.0
dW = np.zeros_like(W)
dW_each = np.zeros_like(W)
num_train, dim = X.shape
num_class = W.shape[1]
f = X.dot(W)
f_max = np.reshape(np.max(f, axis=1), (num_train, 1))
prob = np.exp(f - f_max) / np.sum(np.exp(f - f_max), axis=1, keepdims=True)
y_trueClass = np.zeros_like(prob)
y_trueClass[np.arange(num_train), y] = 1.0
for i in range(num_train):
for j in range(num_class):
loss += -(y_trueClass[i, j] * np.log(prob[i, j]))
dW_each[:, j] = -(y_trueClass[i, j] - prob[i, j]) * X[i, :]
dW += dW_each
loss /= num_train
loss += 0.5 * reg * np.sum(W * W)
dW /= num_train
dW += reg * W
return loss, dW
def softmax_loss_vectorized(W, X, y, reg):
"""
Softmax loss function, vectorized version.
Inputs and outputs are the same as softmax_loss_naive.
"""
loss = 0.0
dW = np.zeros_like(W)
num_train, dim = X.shape
f = X.dot(W)
f_max = np.reshape(np.max(f, axis=1), (num_train, 1))
prob = np.exp(f - f_max) / np.sum(np.exp(f - f_max), axis=1, keepdims=True)
y_trueClass = np.zeros_like(prob)
y_trueClass[range(num_train), y] = 1.0
loss += -np.sum(y_trueClass * np.log(prob)) / num_train + 0.5 * reg * np.sum(W * W)
dW += -np.dot(X.T, y_trueClass - prob) / num_train + reg * W
return loss, dW
- 1
- 2
- 3
- 4
- 5
- 6
- 7
- 8
- 9
- 10
- 11
- 12
- 13
- 14
- 15
- 16
- 17
- 18
- 19
- 20
- 21
- 22
- 23
- 24
- 25
- 26
- 27
- 28
- 29
- 30
- 31
- 32
- 33
- 34
- 35
- 36
- 37
- 38
- 39
- 40
- 41
- 42
- 43
- 44
- 45
- 46
- 47
- 48
- 49
- 50
- 51
- 52
- 53
- 54
- 55
- 56
- 57
- 58
- 59
- 60
- 61
- 62
- 63
- 64
- 65
- 66
- 67
- 68
- 69
- 70
- 71
- 72
Softmax、SVM损失函数用于CIFAR-10图像分类
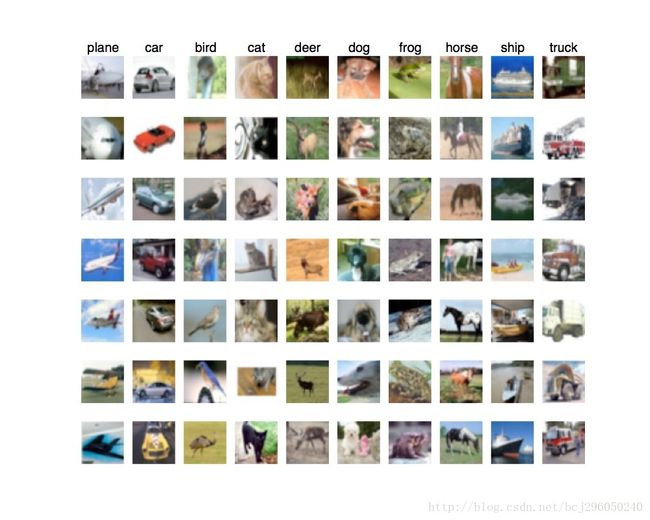
CIFAR-10 小图分类是对于练习而言非常方便的一个数据集。通过在该数据集上实现基本的 softmax 损失函数 和 SVM 损失函数以及可视化部分结果,可以加深对算法的理解。
关于本文的全部代码可以到GitHub中下载
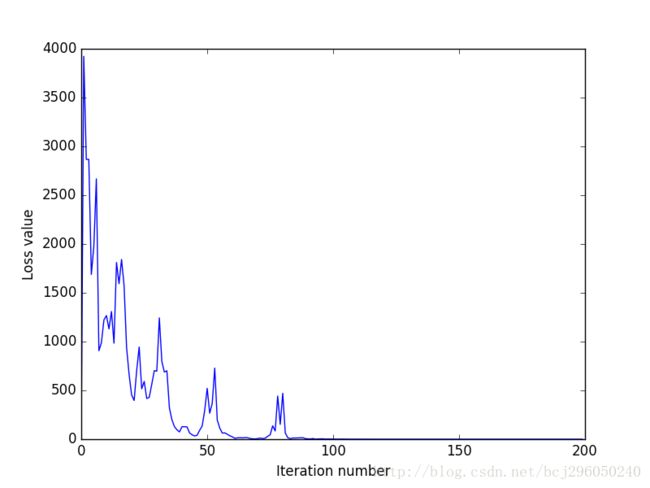
下面给出代码运行过程中的输出结果:
1. 可视化CIFAR-10的部分样本
原始像素作为特征使用SVM分类的损失图
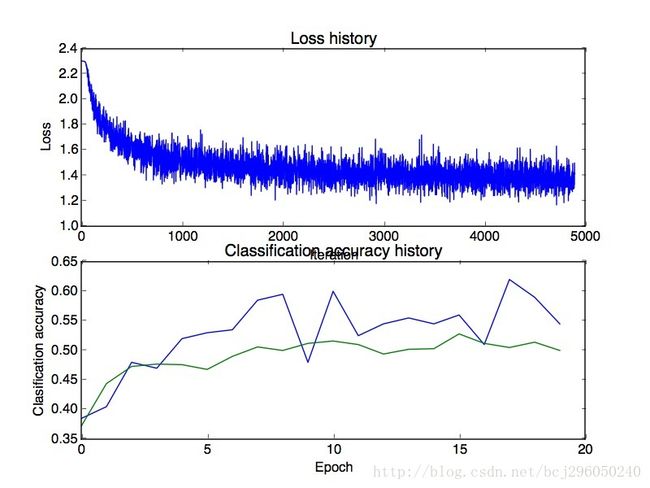
两层神经网络使用softmax分类的损失和准确率图
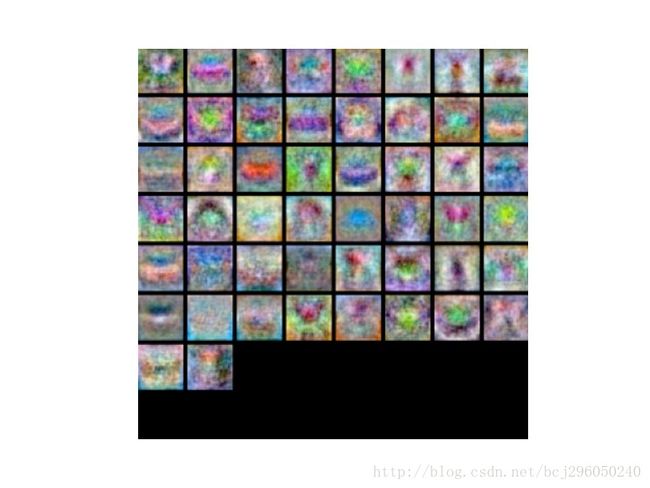
两层神经网络使用softmax分类的第一个隐含层权重图:
参考资料
[1] http://www.jianshu.com/p/004c99623104
[2] http://deeplearning.stanford.edu/wiki/index.php/Softmax%E5%9B%9E%E5%BD%92
[3] http://blog.csdn.net/acdreamers/article/details/44663305
[4] http://cs231n.github.io/
结束
![]()
![]()
![]()
![]()
![]()
![]()