「ML 实践篇」分类系统:图片数字识别
目的:使用 MNIST 数据集,建立数字图像识别模型,识别任意图像中的数字;
文章目录
-
- 1. 数据准备(MNIST)
- 2. 二元分类器(SGD)
- 3. 性能测试
-
- 1. 交叉验证
- 2. 混淆矩阵
- 3. 查准率与查全率
- 4. P-R 曲线
- 5. ROC 曲线
- 6. RandomForestClassifier vs. SGDClassifier
- 4. 多类分类器
- 5. 误差分析
- 6. 多标签分类
- 7. 多输出分类
-
- 1. 消除图片中的噪声
1. 数据准备(MNIST)
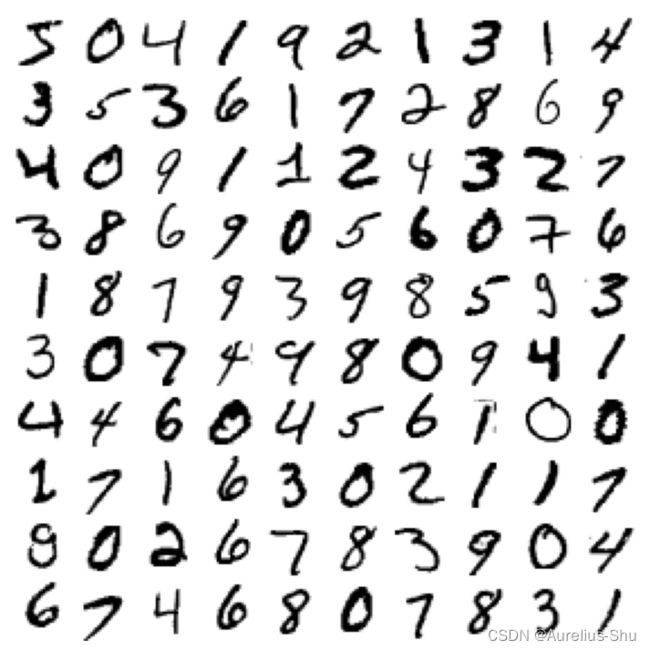
MNIST,一组由美国高中生和人口调查局员工手写的 70000 个数字图片;每张图片都用其代表的数字标记;因广泛被应用于机器学习入门,被称作机器学习领域的Hello World;也可用于测试新分类算法的效果;
使用 Scikit-Learn 下载数据集的前置工作
import ssl
ssl._create_default_https_context = ssl._create_unverified_context
Scikit-Learn 使用 Python 的 urllib 包通过 HTTPS 协议下载数据集,这里全局取消证书验证(否则 Scikit-Learn 可能无法建立 ssl 连接);
使用 Scikit-Learn 下载 MNIST
from sklearn.datasets import fetch_openml
mnist = fetch_openml('mnist_784', version=1)
mnist.keys()

dict_keys(['data', 'target', 'frame', 'categories', 'feature_names', 'target_names', 'DESCR', 'details', 'url'])

### 查看数组
X, y = mnist["data"], mnist["target"]
X.shape

(70000, 784)

y.shape
(70000,)
共 70000 张图片,每张图片由 784 个特征(28 * 28 个像素,每个像素用 0(白色) 到 255(黑色) 表示);
Scikit-Learn 数据集通用字典结构
DESCR,描述数据集;data,包含一个数组,每个实例为一行,每个特征为一列;target,包含一个带有标记的数组;
使用 Matplotlib 查看数字图片
- 编写绘图函数;
import matplotlib.pyplot as plt
import matplotlib as mpl

def plot_digit(data):
    image = data.reshape(28, 28)
    plt.imshow(image, cmap = mpl.cm.binary, interpolation="nearest")
    plt.axis("off")


def plot_digits(instances, images_per_row=10, **options):
    size = 28
    images_per_row = min(len(instances), images_per_row)
    # This is equivalent to n_rows = ceil(len(instances) / images_per_row):
    n_rows = (len(instances) - 1) // images_per_row + 1

    # Append empty images to fill the end of the grid, if needed:
    n_empty = n_rows * images_per_row - len(instances)
    padded_instances = np.concatenate([instances, np.zeros((n_empty, size * size))], axis=0)

    # Reshape the array so it's organized as a grid containing 28×28 images:
    image_grid = padded_instances.reshape((n_rows, images_per_row, size, size))

    # Combine axes 0 and 2 (vertical image grid axis, and vertical image axis),
    # and axes 1 and 3 (horizontal axes). We first need to move the axes that we
    # want to combine next to each other, using transpose(), and only then we
    # can reshape:
    big_image = image_grid.transpose(0, 2, 1, 3).reshape(n_rows * size, images_per_row * size)
    # Now that we have a big image, we just need to show it:
    plt.imshow(big_image, cmap = mpl.cm.binary, **options)
    plt.axis("off")
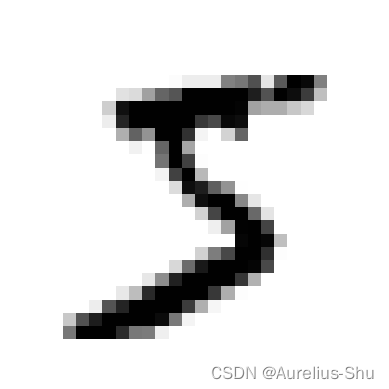
- MNIST 的第一个图片展示;
some_digit = X[:1].to_numpy()
plot_digit(some_digit)
plt.show()
# 查看图片对应标签,验证是一个数字 '5'
y[0]

'5'
- MNIST 的多图样例展示;
plt.figure(figsize=(9,9))
example_images = X[:100]
plot_digits(example_images, images_per_row=10)
# save_fig("more_digits_plot")
plt.show()
将字符标签转换成整数
import numpy as np

y = y.astype(np.uint8)
创建测试集
X_train, X_test, y_train, y_test = X[:60000], X[60000:], y[:60000], y[60000:]
MNIST 数据集已经分成训练集(前 6 万张图片)和测试集(最后 1 万张图片);
可以对训练集进行混洗,保障在做交叉验证时所有折叠的实例分布相当;有一些算法对训练实例的顺序敏感,连续输入相同的实例可能导致性能不佳;也有一些情况时间序列也是实例特征(如股市架构或天气状态),则不可混洗数据集;
2. 二元分类器(SGD)
二元分类器,在两个类中区分;
简化问题,图片数字识别,先从识别图片 是 5 和 非 5 开始;
转换图片的标签
y_train_5 = (y_train == 5)  # True for all 5s, False for all other digits
y_test_5 = (y_test == 5)
使用 Scikit-Learn 的 SGDClassifier 训练随机梯度下降(SGD)分类器
SGD,独立处理训练实例,一次一个,非常适合处理大型的数据集,也适合在线学习;
from sklearn.linear_model import SGDClassifier

sgd_clf = SGDClassifier(random_state=42)
sgd_clf.fit(X_train, y_train_5)
给 random_state 设置固定值,如 =42 可以让 SGD 的随机训练变得结果可复现;
sgd_clf.predict(X[:1])

array([ True])
SGD 分类器预测这是一张 5,结果正确;
3. 性能测试
准确率,正确预测的比率;
1. 交叉验证
自定义实现交叉验证
from sklearn.model_selection import StratifiedKFold
from sklearn.base import clone

skfolds = StratifiedKFold(n_splits=3, random_state=42, shuffle=True)

for train_index, test_index in skfolds.split(X_train, y_train_5):
    clone_clf = clone(sgd_clf)
    X_train_folds = X_train.iloc[train_index]
    y_train_folds = y_train_5.iloc[train_index]
    X_test_fold = X_train.iloc[test_index]
    y_test_fold = y_train_5.iloc[test_index]
    clone_clf.fit(X_train_folds, y_train_folds)
    y_pred = clone_clf.predict(X_test_fold)
    n_correct = sum(y_pred == y_test_fold)
    print(n_correct / len(y_pred))

0.9669
0.91625
0.96785
StratifiedKFold,实现分层抽样;让每个折叠中各个类的比例与整体比例相当;clone,为每个迭代创建一个分类器的副本,用于对训练集的训练和测试集的预测;
使用 Scikit-Learn 的 cross_val_score() 实现 K-折交叉验证
from sklearn.model_selection import cross_val_score
cross_val_score(sgd_clf, X_train, y_train_5, cv=3, scoring="accuracy")

array([0.95035, 0.96035, 0.9604 ])
K-折交叉验证,将训练集分解成 K 个折叠(这里是 3 折),每次留 1 个折叠用于测试集,剩余用于训练集;
所有折叠交叉验证的准确率都超过了 91%,这看似很准确,实则准确率不足以衡量这个分类器的优劣;
自定义 非 5 分类器
from sklearn.base import BaseEstimator

class Never5Classifier(BaseEstimator):
    def fit(self, X, y=None):
        return self
    def predict(self, X):
        return np.zeros((len(X), 1), dtype=bool)

never_5_clf = Never5Classifier()
cross_val_score(never_5_clf, X_train, y_train_5, cv=3, scoring="accuracy")

array([0.91125, 0.90855, 0.90915])
使用自定义 非 5 分类器进行交叉验证,得到所有折叠的准确率也在 90% 以上;这是因为所有图片中只有约 10% 是数字 5,90% 非 5 是正确的;这进一步说明准确率不足以评判分类器的性能(特别是处理有偏数据集时);
2. 混淆矩阵
-
混淆矩阵,对多个二分类或多分类进行训练/测试,统计 A 类实例被分类为 B 类别的次数;是评估分类器性能的常见方法; -
使用 cross_val_predict() 进行 K-折交叉预测
from sklearn.model_selection import cross_val_predict

y_train_pred = cross_val_predict(sgd_clf, X_train, y_train_5, cv=3)
cross_val_predict 与 cross_val_score 类似,但返回的不是交叉验证的评分,而是每个折叠的预测值;
- 使用 confusion_matrix() 获取混淆矩阵
from sklearn.metrics import confusion_matrix

confusion_matrix(y_train_5, y_train_pred)

array([[53892,   687],
       [ 1891,  3530]])
混淆矩阵的行表示实际类别(实际为 非 5、5),列表示预测类别(预测为 非 5、5);
负类(Negative):实际为非 5真负类(TN):53892 个正确分类为非 5;假正类(FP):687 个错误分类为5;
正类(Positive):实际为5假负类(FN):1891 个错误分类为非 5;真正类(TP):3530 个正确分类为5;
完美的分类器只存在真正类与真负类,混淆矩阵的对角线(左上和右下)有非零值;
y_train_perfect_predictions = y_train_5  # pretend we reached perfection
confusion_matrix(y_train_5, y_train_perfect_predictions)

array([[54579,     0],
       [    0,  5421]])
3. 查准率与查全率
查准率(precision),真正类占真正类和假正类之和的比例;将忽略这个正类实例之外的所有内容;
p r e c i s i o n = T P T P + F P precision = \frac{TP}{TP + FP} precision=TP+FPTP
查全率(recall):召回率,灵敏度或真正类率,真正类占所有正类(真正类和假负类)之和的比例;正确检测到的正类实例的比率;
r e c a l l = T P T P + F N recall = \frac{TP}{TP + FN} recall=TP+FNTP
使用 Scikit-Learn 计算查准率和查全率
from sklearn.metrics import precision_score, recall_score

precision_score(y_train_5, y_train_pred) # == 3530 / (3530 + 687)

0.8370879772350012

recall_score(y_train_5, y_train_pred) # == 3530 / (3530 + 1891)

0.6511713705958311
这说明,当这个 5-检测器 说一张图片是 5 时,只有 83% 时准确的,且只有 65% 的 5 被检测出来了;
- F 1 F_1 F1 分数,查准率与查全率的谐波平均值,会给予低值更高的权重;更适用于查准率和查全率相近的分类器;
F 1 = 2 1 p r e c i s i o n + 1 r e c a l l = 2 × p r e c i s i o n × r e c a l l p r e c i s i o n + r e c a l l = T P T P = F N + F P 2 F_1 = \frac{2}{\frac{1}{precision} + \frac{1}{recall}} = 2 \times \frac{precision \times recall}{precision + recall} = \frac{TP}{TP = \frac{FN + FP}{2}} F1=precision1+recall12=2×precision+recallprecision×recall=TP=2FN+FPTP
使用 f1_score() 计算 F 1 F_1 F1 分数
from sklearn.metrics import f1_score

f1_score(y_train_5, y_train_pred)

0.7325171197343846
鱼与熊掌不可得兼,不能同时兼顾查准率和查全率;
-
对于
宁缺毋滥类型的分类器,更在乎查准率(如给小孩子推荐视频); -
对于
宁杀错不放过类型的分类器,更在乎查全率(如小区监控抓小偷);
4. P-R 曲线
P-R 曲线,将实例按预测为正类的概率高低排序,然后逐个把样本作为正类进行预测评估,计算其查准率和查全率,以查全率为横轴,查准率为纵轴绘制一个曲线图;
SGDClassifier 的分类决策
基于决策函数计算处每个实例的分值;将每个实例按分数从低到高从左到右排列;取一个阈值,大于该阈值的实例为正类,否则为负类;(通常阈值越高,查全率越低,查准率越高);
- 若决策阈值在中间箭头位置(两个 5 之间),查准率为 80%(4/5),查全率为 67%(4/6);
- 若决策阈值在右边箭头位置(提升阈值),查准率为 100%(3/3),查全率为 50%(3/6);
- 若决策阈值在左边箭头位置(降低阈值),查准率为 75%(6/8),查全率为 100%(6/6);
使用 decision_function() 获取每个实例的分数
y_scores = sgd_clf.decision_function(some_digit)
y_scores

array([2164.22030239])
- 通过阈值控制预测结果;
threshold = 0
y_some_digit_pred = (y_scores > threshold)
y_some_digit_pred

array([ True])
- 提升阈值控制预测结果;
threshold = 8000
y_some_digit_pred = (y_scores > threshold)
y_some_digit_pred

array([False])
提升阈值可以降低查全率(将本是 5 的图片判定为了非 5);
使用 cross_val_predict() 获取训练集的实例分数
y_scores = cross_val_predict(sgd_clf, X_train, y_train_5, cv=3, method="decision_function")
使用 precision_recall_curve() 计算所有阈值对应的查准率和查全率
from sklearn.metrics import precision_recall_curve

precisions, recalls, thresholds = precision_recall_curve(y_train_5, y_scores)
绘制查准率和查全率与决策阈值的关系曲线
def plot_precision_recall_vs_threshold(precisions, recalls, thresholds):
    plt.plot(thresholds, precisions[:-1], "b--", label="Precision", linewidth=2)
    plt.plot(thresholds, recalls[:-1], "g-", label="Recall", linewidth=2)
    plt.legend(loc="center right", fontsize=16)
    plt.xlabel("Threshold", fontsize=16)
    plt.grid(True)
    plt.axis([-50000, 50000, 0, 1])


recall_90_precision = recalls[np.argmax(precisions >= 0.90)]
threshold_90_precision = thresholds[np.argmax(precisions >= 0.90)]


plt.figure(figsize=(8, 4))
plot_precision_recall_vs_threshold(precisions, recalls, thresholds)
plt.plot([threshold_90_precision, threshold_90_precision], [0., 0.9], "r:")
plt.plot([-50000, threshold_90_precision], [0.9, 0.9], "r:")
plt.plot([-50000, threshold_90_precision], [recall_90_precision, recall_90_precision], "r:")
plt.plot([threshold_90_precision], [0.9], "ro")
plt.plot([threshold_90_precision], [recall_90_precision], "ro")
plt.show()
查准率比查全率曲线要崎岖一些,因为随着阈值的提升,查准率可能会下降,但查全率只会下降;
绘制 P/R 曲线
以查全率为横轴,查准率为纵轴,将上文决策阈值关系图转化成一张 P-R 曲线;
def plot_precision_vs_recall(precisions, recalls):
    plt.plot(recalls, precisions, "b-", linewidth=2)
    plt.xlabel("Recall", fontsize=16)
    plt.ylabel("Precision", fontsize=16)
    plt.axis([0, 1, 0, 1])
    plt.grid(True)

plt.figure(figsize=(8, 6))
plot_precision_vs_recall(precisions, recalls)
plt.plot([recall_90_precision, recall_90_precision], [0., 0.9], "r:")
plt.plot([0.0, recall_90_precision], [0.9, 0.9], "r:")
plt.plot([recall_90_precision], [0.9], "ro")
plt.show()
查全率在 80% 之后,查准率急剧下降,说明可能需要在此之前选择一个权衡点;
通常若学习器 A 的 P-R 曲线能完全包住学习器 B 的,则可断言 A 优于 B;若存在交叉,可采用面积比较法,或平衡点比较法;
查找指定查准率/查全率的最低/最高阈值
>>> threshold_90_precision = thresholds[np.argmax(precisions >= 0.90)]
3370.0194991439557 # 第一个 True 的最大索引

>>> threshold_90_recall = thresholds[np.argmin(recalls >= 0.90)]
-6861.032537940274 # 第一个 True 的最小索引
使用实例分数与阈值进行预测
>>> y_train_pred_90 = (y_scores >= threshold_90_precision)

array([False, False, False, ...,  True, False, False])
- 查看预测的查准率与查全率;
>>> precision_score(y_train_5, y_train_pred_90)
0.9000345901072293

>>> recall_score(y_train_5, y_train_pred_90)
0.4799852425751706
查准率确实是指定的 90%;
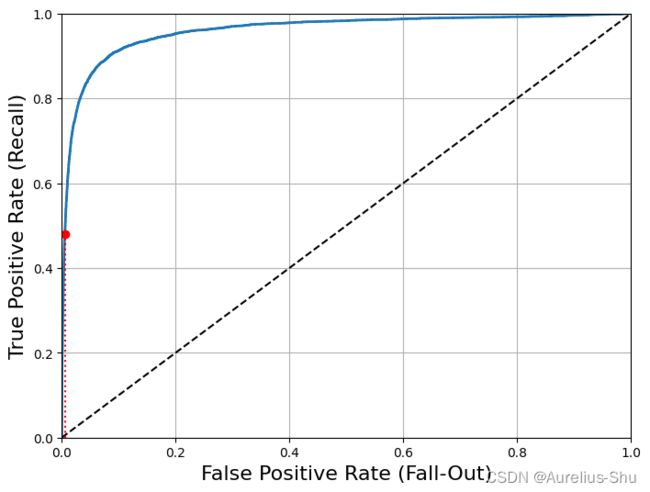
5. ROC 曲线
-
ROC(Receiver Operating Characteristic,受试者工作特征),以真正类率为纵轴,以假正类率为横轴;描述的是查全率与(1 - 特异度)的关系;与 P-R 图相似,若学习器 A 的曲线完全包住学习器 B 的曲线,则可可断言 A 优于 B; -
真正类率,查全率、灵敏度、召回率、True Positive Rate,TPR= T P T P + F N \frac{TP}{TP + FN} TP+FNTP,所有正类中被测出来的正类的概率; -
假正类率,False Positive Rate,FPR= F P T N + F P \frac{FP}{TN + FP} TN+FPFP,所有负类中被错认为正类的概率; -
真负类率,TNR,特异率,正确被分类为负类的负类实例比率;
使用 roc_curve() 计算多种阈值的 TPR 和 FPR
from sklearn.metrics import roc_curve

fpr, tpr, thresholds = roc_curve(y_train_5, y_scores)
通过 Matplotlib 绘制 ROC 曲线
def plot_roc_curve(fpr, tpr, label=None):
    plt.plot(fpr, tpr, linewidth=2, label=label)
    plt.plot([0, 1], [0, 1], 'k--')  # dashed diagonal
    plt.axis([0, 1, 0, 1])
    plt.xlabel('False Positive Rate (Fall-Out)', fontsize=16)
    plt.ylabel('True Positive Rate (Recall)', fontsize=16)
    plt.grid(True)


plt.figure(figsize=(8, 6))
plot_roc_curve(fpr, tpr)
fpr_90 = fpr[np.argmax(tpr >= recall_90_precision)]
plt.plot([fpr_90, fpr_90], [0., recall_90_precision], "r:")
plt.plot([0.0, fpr_90], [recall_90_precision, recall_90_precision], "r:")
plt.plot([fpr_90], [recall_90_precision], "ro")
plt.show()
召回率(TPR)越高,分类器的假正类(FPR)就越多(虚线表示纯随机分类器的 ROC 曲线,越高于虚线的 ROC 曲线,对应的分类器越优);
使用 Scikit-Learn 计算 ROC 的 AUC
AUC,Area Under ROC Curve,ROC 曲线下的面积;当 ROC 曲线相交时,可通过 AUC 判定学习器的好坏;
from sklearn.metrics import roc_auc_score

>>> roc_auc_score(y_train_5, y_scores)
0.9604938554008616
这里 ROC AUC 分值看着很高,是因为正类(数字 5)比负类(非 5)的数量少很多;
P-R 曲线与 ROC 曲线的选择
当正类非常少见或者更关注假正类而非假负类是,选择 P-R 曲线;反之选择 ROC 曲线;
6. RandomForestClassifier vs. SGDClassifier
RandomForestClassifier 没有 decision_function(),代替的是 dict_proba();
dict_proba(),返回一个数组,每行代表一个实例,每列表示一个类别,代表某个实例属于某个给定类别的概率;
训练 RandomForestClassifier 分类器
from sklearn.ensemble import RandomForestClassifier

forest_clf = RandomForestClassifier(random_state=42)
y_probas_forest = cross_val_predict(forest_clf, X_train, y_train_5, cv=3, method="predict_proba")

y_scores_forest = y_probas_forest[:, 1]   # score = proba of positive class
fpr_forest, tpr_forest, thresholds_forest = roc_curve(y_train_5, y_scores_forest)
这里将正类率作为分数传递给 roc_curve();
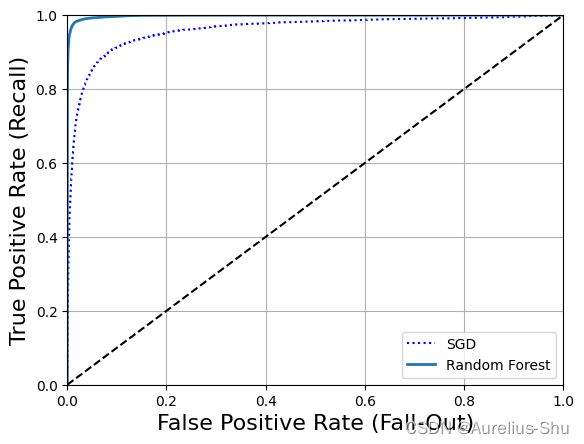
绘制 RandomForestClassifier 分类器的 ROC 曲线
plt.plot(fpr, tpr, "b:", label="SGD")
plot_roc_curve(fpr_forest, tpr_forest, "Random Forest")
plt.legend(loc="lower right")
plt.show()
RandomForestClassifier 的 ROC 曲线比 SGDClassifier 好很多;
# ROC AUC 分数
>>> roc_auc_score(y_train_5, y_scores_forest)
0.9983436731328145

# 查准率
y_train_pred_forest = cross_val_predict(forest_clf, X_train, y_train_5, cv=3)
>>> precision_score(y_train_5, y_train_pred_forest)
0.9905083315756169

# 查全率(召回率)
>>> recall_score(y_train_5, y_train_pred_forest)
0.8662608374838591
RandomForestClassifier 的效果确实好很多(查准率与查全率都比较高);
4. 多类分类器
多元分类器,多项分类器,在两个以上的类别中区分;
随机森林、朴素贝叶斯等分类器可以直接处理多个类;支持向量机、线性分类器则是严格的二元分类器,但是可以通过一些策略让二院分类器实现多分类的目的;
OvR,一对剩余,一对多(one-versus-all),训练 10 个二元分类器(0-检测器、1-检测器、2-检测器…),当需要检测一张图片时,先获取每个分类器的决策分数,哪个分类器的分值最高,图片归为哪一类;OvO,一对一,训练 N × ( N − 1 ) 2 \frac{N \times (N - 1)}{2} 2N×(N−1) 个分类器,为每一对数字训练一个二元分类器(0-1 分类器、0-2 分类器、1-2 分类器…);优点是,每个分类器只需要用到部分训练集对其必须区分的两个类进行训练;
支持向量机在数据规模较大时表现较差,因此应优先选择 OvO 策略,但对于大多数二分类器来书,OvR 是更好的选择;
使用 Scikit-Learn 训练 SVM 分类器
>>> from sklearn.svm import SVC
>>> svm_clf = SVC()
>>> svm_clf.fit(X_train, y_train) # y_train, not y_train_5
>>> svm_clf.predict([some_digit])
array([5], dtype=uint8)
Scikit-Learn 检测到尝试使用二元分类算法进行多类分类任务时,会自动运行 OvR 或 OvO;
这里 Scikit-Learn 实际训练了 45 个二元分类器,获得它们对图片的决策分数,然后选择了分数最高的类;
使用 decision_function() 查看 SVM 分类器的分数
>>> some_digit_scores = svm_clf.decision_function(some_digit)
>>> some_digit_scores
array([[ 1.72501977,  2.72809088,  7.2510018 ,  8.3076379 , -0.31087254,
         9.3132482 ,  1.70975103,  2.76765202,  6.23049537,  4.84771048]])
查看分数最高的分类
>>> np.argmax(some_digit_scores)
5
>>> svm_clf.classes_
array([0, 1, 2, 3, 4, 5, 6, 7, 8, 9], dtype=uint8)
>>> svm_clf.classes_[5]
5
classes_,存储目标类的列表,按值的大小排序(索引与类值不一定相同);
强制使用 OneVsRestClassifier 策略训练 SVC 多类分类器
>>> from sklearn.multiclass import OneVsRestClassifier
>>> ovr_clf = OneVsRestClassifier(SVC())
>>> ovr_clf.fit(X_train, y_train)
>>> ovr_clf.predict(some_digit)
array([5], dtype=uint8)
>>> len(ovr_clf.estimators_)
10
OneVsRestClassifier,OvR 策略实现类;OneVsOneClassifier,OvO 策略实现类;
训练 SGDClassifier 的多类分类器
>>> sgd_clf.fit(X_train, y_train)
>>> sgd_clf.predict([some_digit])
array([3], dtype=uint8)
SGC 分类器可以直接将实例分为多个类,不必运行 OvR 或 OvO;
使用 decision_function() 计算每个实例分类为每个类的概率
>>> sgd_clf.decision_function(some_digit)
array([[-31893.03095419, -34419.69069632,  -9530.63950739,
          1823.73154031, -22320.14822878,  -1385.80478895,
        -26188.91070951, -16147.51323997,  -4604.35491274,
        -12050.767298  ]])
第 3 类得分 1823,其他都是负分值(预测错误,实际是 5);
使用 scross_val_score() 评估 SGDClassifier 的准确性
>>> cross_val_score(sgd_clf, X_train, y_train, cv=3, scoring="accuracy")
array([0.87365, 0.85835, 0.8689 ])
每个折叠的准确率在 85% 以上(随机分类器准确率约为 10%);
通过缩放对 SGD 分离进行优化
>>> from sklearn.preprocessing import StandardScaler
>>> scaler = StandardScaler()
>>> X_train_scaled = scaler.fit_transform(X_train.astype(np.float64))
>>> cross_val_score(sgd_clf, X_train_scaled, y_train, cv=3, scoring="accuracy")
array([0.8983, 0.891 , 0.9018])
简单缩放训练集数据后,准确率提升到 89%;
5. 误差分析
使用 cross_val_predict() 进行预测并计算混淆矩阵
>>> y_train_pred = cross_val_predict(sgd_clf, X_train_scaled, y_train, cv=3)
>>> conf_mx = confusion_matrix(y_train, y_train_pred)
>>> conf_mx
array([[5577,    0,   22,    5,    8,   43,   36,    6,  225,    1],
       [   0, 6400,   37,   24,    4,   44,    4,    7,  212,   10],
       [  27,   27, 5220,   92,   73,   27,   67,   36,  378,   11],
       [  22,   17,  117, 5227,    2,  203,   27,   40,  403,   73],
       [  12,   14,   41,    9, 5182,   12,   34,   27,  347,  164],
       [  27,   15,   30,  168,   53, 4444,   75,   14,  535,   60],
       [  30,   15,   42,    3,   44,   97, 5552,    3,  131,    1],
       [  21,   10,   51,   30,   49,   12,    3, 5684,  195,  210],
       [  17,   63,   48,   86,    3,  126,   25,   10, 5429,   44],
       [  25,   18,   30,   64,  118,   36,    1,  179,  371, 5107]])
使用 Matplotlib 的 matshow() 查看混淆矩阵
plt.matshow(conf_mx, cmap=plt.cm.gray)
plt.show()
大多数图片被分到对角线上,说明它们被正确分类了;数字 5 略暗,说明可能数字 5 较少,也可能数字 5 的分类效果不如其他数字;
将混淆矩阵中的每个值除以相应类中的图片数量,这样比较的就是错误率(而非错误的绝对值)
row_sums = conf_mx.sum(axis=1, keepdims=True)
norm_conf_mx = conf_mx / row_sums
重新绘制混淆矩阵效果图
用 0 填充对角线,只看错误部分;
np.fill_diagonal(norm_conf_mx, 0)
plt.matshow(norm_conf_mx, cmap=plt.cm.gray)
plt.show()
每行代表实际类、每列代表预测类;
- 第 8 列比较亮,说明许多图片被错误的分类为了 8;
- 改进数字 8 的分类错误,可以试着收集更多像数字 8 的训练数据,以便分类器学会将它们与真实的数字 8 区分开;也可以开发一些新特征用来改进分类器(计算闭环的数量,如 8 有两个、6 有一个、5 没有);还可以对图片进行预处理(Scikit-Image、Pillow、OpenCV 等),让某些模式更为突出,如闭环等;
- 数字 3 和数字 5 经常被混淆,两个方向的交叉处较亮;
- 可以分析单个错误示例在做什么,为何失败;
查看数字 3 和数字 5
cl_a, cl_b = 3, 5
X_aa = X_train[(y_train == cl_a) & (y_train_pred == cl_a)]
X_ab = X_train[(y_train == cl_a) & (y_train_pred == cl_b)]
X_ba = X_train[(y_train == cl_b) & (y_train_pred == cl_a)]
X_bb = X_train[(y_train == cl_b) & (y_train_pred == cl_b)]
plt.figure(figsize=(8,8))
plt.subplot(221); plot_digits(X_aa[:25], images_per_row=5)
plt.subplot(222); plot_digits(X_ab[:25], images_per_row=5)
plt.subplot(223); plot_digits(X_ba[:25], images_per_row=5)
plt.subplot(224); plot_digits(X_bb[:25], images_per_row=5)
plt.show()
左侧两个 5 × 5 5 \times 5 5×5 矩阵显示了呗分类为数字 3 的图片,右侧两个 5 × 5 5 \times 5 5×5 矩阵显示了被分类为数字 5 的图片(左下和右上为分类错误示例);
SGD 是一个简单的线性模型,它为每一个像素分配一个各个类别的权重,当它看到新图片时,将加权后的 像素强度汇总,从而得到一个分数进行分类;而 3 和 5 的像素位大多重叠,因此容易混淆;
减少 3 和 5 之间混淆的方式可以是对图片进行预处理,如确保他们在中心位置且没有选择;
6. 多标签分类
多标签分类,分类器为每个实例输出多个类(如一张图片识别出多个人);
使用 KNeighborsClassifier 创建多标签分类
KNeighborsClassifier,支持多标签分类,不是所有分类器都支持;
>>> from sklearn.neighbors import KNeighborsClassifier
>>> y_train_large = (y_train >= 7)      # 大数标签
>>> y_train_odd = (y_train % 2 == 1)    # 奇数标签
>>> y_multilabel = np.c_[y_train_large, y_train_odd] # 多标签数组
>>> knn_clf = KNeighborsClassifier()
>>> knn_clf.fit(X_train, y_multilabel)
>>> knn_clf.predict(some_digit)
array([[False,  True]])
分类正确:数字 5 不是大数,是奇数;
多标签分类器的性能评估
>>> y_train_knn_pred = cross_val_predict(knn_clf, X_train, y_multilabel, cv=3)
>>> f1_score(y_multilabel, y_train_knn_pred, average="macro")
0.976410265560605
假设所有标签都同等重要,可以通过测量每个标签的 F 1 F_1 F1 分数(或其他任何二元分类器指标),并计算它们的平均分数;
但实际往往并发如此,比如识别图片中的多个人,其中有的人可能拍了很多照片,那这个人的权重就要高很多;这时需要给每个标签设置一个相当的权重(可以是具有该目标标签的实例的数量);
7. 多输出分类
多输出分类,或称多输出多分类,是多标签分类的泛化,其标签也可以是多类的;
1. 消除图片中的噪声
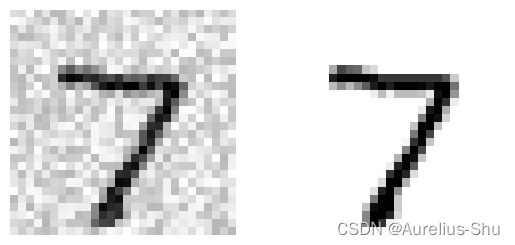
目标:构建一个系统,输入一张有噪声的图片,系统输出一张干净的数字图片;
分类和回归之间有时是模糊的,这个示例即可一说是多输出分类任务,也可以说是像素强度的回归任务;
使用 NumPy 的 randint() 为 MNIST 图片添加噪声
noise = np.random.randint(0, 100, (len(X_train), 784))
X_train_mod = X_train + noise
noise = np.random.randint(0, 100, (len(X_test), 784))
X_test_mod = X_test + noise
y_train_mod = X_train
y_test_mod = X_test
查看图片样例
plt.subplot(121)
plot_digit(X_test_mod[:1].to_numpy())
plt.subplot(122)
plot_digit(y_test_mod[:1].to_numpy())
plt.show()
通过训练分类器,清洗噪声图片
knn_clf.fit(X_train_mod, y_train_mod)
clean_digit = knn_clf.predict(X_test_mod[:1].to_numpy())
plot_digit(clean_digit)
清洗后的效果与原图相近了!
- 上一篇:「ML 实践篇」回归系统:房价中位数预测
- 专栏:《机器学习》
PS:欢迎各路道友阅读与评论,感谢道友点赞、关注、收藏!
参考资料:
- [1]《机器学习》
- [2]《机器学习实战》
