2021年“泰迪杯”数据分析技能赛B 题+肥料登记数据分析数据集
2021 年“泰迪杯”数据分析技能赛
B 题
肥料登记数据分析
一、背景
肥料是农业生产中一种重要的生产资料,其生产销售必须遵循《肥料登记管
理办法》,依法在农业行政管理部门进行登记。各省、自治区、直辖市人民政府
农业行政主管部门主要负责本行政区域内销售的肥料登记工作,相关数据可从政
府网站上自由下载。
二、目标
- 对肥料登记数据进行预处理。
- 根据养分的百分比对肥料产品进行细分。
- 从省份、日期、生产商、肥料构成等维度对肥料登记数据进行对比分析。
- 对非结构化数据进行结构化处理。
三、任务
请根据附件 1~附件 4 中提供的数据,自行选择分析工具完成以下任务,并
撰写报告。
任务 1 数据的预处理
任务 1.1 附件 1 的产品通用名称存在不规范的情况。请按照复混肥料(掺
混肥料归入这一类)、有机-无机复混肥料、有机肥料和床土调酸剂这 4 种类别
对附件 1 进行规范化处理。请在报告中给出处理思路、过程及必要的结果,同时
将完整的结果保存到文件“result1_1.xlsx”中。
import pandas as pd
import numpy as np
pd.set_option("max_columns",None) #显示所有列
pd.set_option("max_rows",None) #显示所有行
df=pd.read_excel("data/附件1.xlsx")
print(df)
df["产品通用名称"].replace(to_replace=".*有机.*无机.*复混肥料",value="有机-无机复混肥料",regex=True,inplace=True)
df["产品通用名称"].replace(to_replace="稻苗床土调酸剂",value="床土调酸剂",regex=True,inplace=True)
df["产品通用名称"].replace(to_replace=".*掺混肥料.*",value="复混肥料",regex=True,inplace=True)
df["产品通用名称"]=df["产品通用名称"].map(lambda a:"有机肥料" if a.__contains__("有机肥料") else a)
df.to_excel("data/result1_1.xlsx",index=True)#写入excel表
任务 1.2 计算附件 1 中各肥料产品的氮、磷、钾养分百分比之和,称为总
无机养分百分比。请在报告中给出处理思路、过程及必要的结果,同时将完整的
结果保存到文件“result1_2.xlsx”中,结果保留 3 位小数(例如 1.0%,即 0.010)。
df["总无机养分百分比"]=df[["总氮百分比","P2O5百分比","K2O百分比"]].apply(lambda a:round(a[0]+a[1]+a[2],3),axis=1)
df.to_excel("result1_2.xlsx",index=True)#写入excel表
任务 2 肥料产品的数据分析
任务 2.1 从附件 2 中筛选出复混肥料的产品,将所有复混肥料按照总无机
养分百分比的取值等距分为 10 组。根据每个产品所在的分组,为其打上分组标
签(标签用 1~10 表示),将完整的结果保存到文件“result2_1.xlsx”中。分析复
混肥料产品的分布特点,在报告中绘制产品登记数量的直方图,给出处理思路及
过程,并按登记数量从大到小列出登记数量最大的前 3 个分组及相应的产品登记
数量。
import pandas as pd
import numpy as np

pd.set_option("max_columns",None) #显示所有列
pd.set_option("max_rows",None) #显示所有行
df=pd.read_excel("data/附件2.xlsx")
# print(df)
df=df[df["产品通用名称"]=="复混肥料"].copy()
data=df["总无机养分百分比"]
bins=np.linspace(df["总无机养分百分比"].min(),df["总无机养分百分比"].max(),11)
df["组"]=pd.cut(data,bins,include_lowest=True,labels=[1,2,3,4,5,6,7,8,9,10])
df.to_excel("result2_1.xlsx",index=True)#写入excel表
任务 2.2 从附件 2 中筛选出有机肥料的产品,将产品按照总无机养分百分
比和有机质百分比分别等距分为 10 组,并为每个产品打上分组标签 (1,1), (1,2),
⋯, (10,10),将完整的结果保存到文件“result2_2.xlsx”中。请在报告中给出处理
思路及过程,并根据分组情况绘制有机肥料产品的分布热力图,其中横轴代表总
无机养分分组,纵轴代表有机质分组。在此基础上,分析有机肥料产品的分布特
点,并按登记数量从大到小列出登记数量最大的前 3 个分组及相应的产品登记数
量。
注意:此任务图标未显示!
import pandas as pd
import numpy as np
import matplotlib.pyplot as plt
pd.set_option("max_columns",None) #显示所有列
# pd.set_option("max_rows",None) #显示所有行
df=pd.read_excel("data/附件2.xlsx")
# print(df)
# df=df[df["产品通用名称"]=="复混肥料"].copy()
data=df["总无机养分百分比"]
bins=np.linspace(df["总无机养分百分比"].min(),df["总无机养分百分比"].max(),11)
df["组"]=pd.cut(data,bins,include_lowest=True,labels=[1,2,3,4,5,6,7,8,9,10])
# df.to_excel("result1_2.xlsx",index=True)#写入excel表
df1=df[df["产品通用名称"]=="复混肥料"].copy()
bins=np.linspace(df1["总无机养分百分比"].min(),df1["总无机养分百分比"].max(),11)
#每个小组的标签
label=list(range(1,11))
df["label1"]=pd.cut(df1["总无机养分百分比"],bins,include_lowest=True,labels=label)
#按有机质百分比的取值进行分组
bins1=np.linspace(df1["有机质百分比"].min(),df1["有机质百分比"].max(),11)
df["label2"]=pd.cut(df1["有机质百分比"],bins1,include_lowest=True,labels=label)
df["label"]=df[["label1","label2"]].apply(lambda a:(a[0],a[1]),axis=1)
# df.to_excel("result2_2.xlsx",index=True)#写入excel表
c=df["label1"].value_counts().head(3)

x = np.random.rand(100).reshape(10, 10)
plt.xticks(df["组"])
plt.yticks(c)
plt.imshow(x, cmap=plt.cm.hot, vmin=0, vmax=1)
plt.title('color-fast')
plt.colorbar()
plt.show()
任务 2.3 从附件 2 中筛选出复混肥料的产品,按照氮、磷、钾养分的百分
比,使用聚类算法将这些产品分为 4 类。根据聚类结果为每个产品打上聚类标签
(标签用 1~4 表示),并将完整的结果保存到文件“result2_3.xlsx”中。请在报
告中给出处理思路及过程,根据聚类标签绘制肥料产品的三维散点图和散点图矩
阵,并通过绘制聚类结果的雷达图分析每个聚类的特征。
任务 3 肥料产品的多维度对比分析
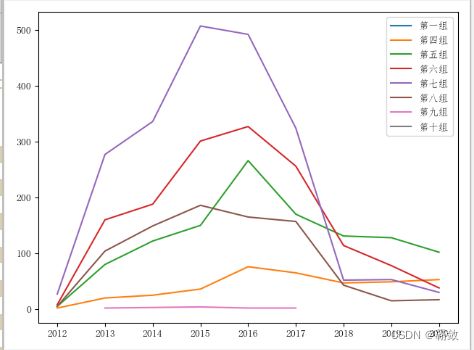
任务 3.1 从文件“result2_1.xlsx”中提取发证日期中的年份,分析比较复混
肥料中各组别不同年份产品登记数量的变化趋势。请在报告中给出处理思路及分
析过程,使用合适的图表对结果进行可视化。
import numpy as np
import pandas as pd
import matplotlib.pyplot as plt
plt.rcParams["font.family"]="FangSong"
pd.set_option("max_columns",None) #显示所有列
# pd.set_option("max_rows",None) #显示所有行
df=pd.read_excel("result2_1.xlsx")
print(df)
df["发证年份"]=df["发证日期"].str[:4]
shu=df.groupby(["label","发证年份"]).count()["序号"].unstack()
# print(df)
plt.plot(shu.columns,shu.loc[1],label="第一组")
plt.plot(shu.columns,shu.loc[4],label="第四组")
plt.plot(shu.columns,shu.loc[5],label="第五组")
plt.plot(shu.columns,shu.loc[6],label="第六组")
plt.plot(shu.columns,shu.loc[7],label="第七组")
plt.plot(shu.columns,shu.loc[8],label="第八组")
plt.plot(shu.columns,shu.loc[9],label="第九组")
plt.plot(shu.columns,shu.loc[10],label="第十组")
plt.legend()
plt.show()
结果:

任务 3.2 从文件“result2_2.xlsx”中提取 2021 年 9 月 30 日仍有效的有机
肥料产品,将完整的结果保存到文件“result3_2.xlsx”中。从有效产品中分别筛
选出广西和湖北(根据正式登记证号区分)产品登记数量在前 5 的组别,分析两
个省份上述组别的分布差异。请在报告中给出处理过程及分析结果。
import numpy as np
import pandas as pd
import matplotlib.pyplot as plt
plt.rcParams["font.family"]="FangSong"
pd.set_option("max_columns",None) #显示所有列
# pd.set_option("max_rows",None) #显示所有行
df=pd.read_excel("result2_2.xlsx")
print(df)
df["有效期_new"]=df["有效期"].str[:7]
# print(df)
data=df[df["有效期_new"] >= "2021-10"].copy()
#数据显示有问题,需要删除这几条数据
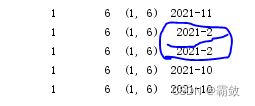
data.drop(index=data[data["有效期_new"].str.len()==6].index,inplace=True)
print(data)
# data.to_excel("result3_2.xlsx",index=True)#写入excel表
print(data[data["正式登记证号"].str[0] == '桂']["label"].value_counts())
print(data[data["正式登记证号"].str[0] == '鄂']["label"].value_counts())
