- 机器学习与深度学习间关系与区别
ℒℴѵℯ心·动ꦿ໊ོ꫞
人工智能学习深度学习python
一、机器学习概述定义机器学习(MachineLearning,ML)是一种通过数据驱动的方法,利用统计学和计算算法来训练模型,使计算机能够从数据中学习并自动进行预测或决策。机器学习通过分析大量数据样本,识别其中的模式和规律,从而对新的数据进行判断。其核心在于通过训练过程,让模型不断优化和提升其预测准确性。主要类型1.监督学习(SupervisedLearning)监督学习是指在训练数据集中包含输入
- JavaScript 中,深拷贝(Deep Copy)和浅拷贝(Shallow Copy)
跳房子的前端
前端面试javascript开发语言ecmascript
在JavaScript中,深拷贝(DeepCopy)和浅拷贝(ShallowCopy)是用于复制对象或数组的两种不同方法。了解它们的区别和应用场景对于避免潜在的bugs和高效地处理数据非常重要。以下是对深拷贝和浅拷贝的详细解释,包括它们的概念、用途、优缺点以及实现方式。1.浅拷贝(ShallowCopy)概念定义:浅拷贝是指创建一个新的对象或数组,其中包含了原对象或数组的基本数据类型的值和对引用数
- 深度 Qlearning:在直播推荐系统中的应用
AGI通用人工智能之禅
程序员提升自我硅基计算碳基计算认知计算生物计算深度学习神经网络大数据AIGCAGILLMJavaPython架构设计Agent程序员实现财富自由
深度Q-learning:在直播推荐系统中的应用关键词:深度Q-learning,强化学习,直播推荐系统,个性化推荐1.背景介绍1.1问题的由来随着互联网技术的飞速发展,直播平台如雨后春笋般涌现。面对海量的直播内容,用户很难快速找到自己感兴趣的内容。因此,个性化推荐系统在直播平台中扮演着越来越重要的角色。1.2研究现状目前,主流的个性化推荐算法包括协同过滤、基于内容的推荐等。这些方法在一定程度上缓
- 深度学习-点击率预估-研究论文2024-09-14速读
sp_fyf_2024
深度学习人工智能
深度学习-点击率预估-研究论文2024-09-14速读1.DeepTargetSessionInterestNetworkforClick-ThroughRatePredictionHZhong,JMa,XDuan,SGu,JYao-2024InternationalJointConferenceonNeuralNetworks,2024深度目标会话兴趣网络用于点击率预测摘要:这篇文章提出了一种新
- 探索未来,大规模分布式深度强化学习——深入解析IMPALA架构
汤萌妮Margaret
探索未来,大规模分布式深度强化学习——深入解析IMPALA架构scalable_agent项目地址:https://gitcode.com/gh_mirrors/sc/scalable_agent在当今的人工智能研究前沿,深度强化学习(DRL)因其在复杂任务中的卓越表现而备受瞩目。本文要介绍的是一个开源于GitHub的重量级项目:“ScalableDistributedDeep-RLwithImp
- 云服务业界动态简报-20180128
Captain7
一、青云青云QingCloud推出深度学习平台DeepLearningonQingCloud,包含了主流的深度学习框架及数据科学工具包,通过QingCloudAppCenter一键部署交付,可以让算法工程师和数据科学家快速构建深度学习开发环境,将更多的精力放在模型和算法调优。二、腾讯云1.腾讯云正式发布腾讯专有云TCE(TencentCloudEnterprise)矩阵,涵盖企业版、大数据版、AI
- 机器学习VS深度学习
nfgo
机器学习
机器学习(MachineLearning,ML)和深度学习(DeepLearning,DL)是人工智能(AI)的两个子领域,它们有许多相似之处,但在技术实现和应用范围上也有显著区别。下面从几个方面对两者进行区分:1.概念层面机器学习:是让计算机通过算法从数据中自动学习和改进的技术。它依赖于手动设计的特征和数学模型来进行学习,常用的模型有决策树、支持向量机、线性回归等。深度学习:是机器学习的一个子领
- ResNet的半监督和半弱监督模型
Valar_Morghulis
Billion-scalesemi-supervisedlearningforimageclassificationhttps://arxiv.org/pdf/1905.00546.pdfhttps://github.com/facebookresearch/semi-supervised-ImageNet1K-models/权重在timm中也有:https://hub.fastgit.org/r
- 联邦学习 Federated learning Google I/O‘19 笔记
努力搬砖的星期五
笔记联邦学习机器学习机器学习tensorflow
FederatedLearning:MachineLearningonDecentralizeddatahttps://www.youtube.com/watch?v=89BGjQYA0uE文章目录FederatedLearning:MachineLearningonDecentralizeddata1.DecentralizeddataEdgedevicesGboard:mobilekeyboa
- PCL 怎样可视化深度图像
LeonDL168
PCL计算机视觉人工智能视觉检测图像处理算法
本小节讲解如何可视化深度图像的两种方法,在3D视窗中以点云形式进行可视化(深度图像来源于点云),另一种是,将深度值映射为颜色,从而以彩色图像方式可视化深度图像。代码首先,在PCL(PointCloudLearning)中国协助发行的书提供光盘的第7章例2文件夹中,打开名为range_image_visualization.cpp的代码文件,同文件夹下可以找到相关的测试点云文件room_scan1.
- el-dialog高度设置
夏之小星星
前端vue.jselementuicss
el-dialog高度设置::v-deep.el-dialog{height:78vh;overflow:auto;}
- elementuiPlus取消el-input的边框
qq_39016177
elementui
elementuiPlus取消el-input的边框1.通常取消边框的方法设置border为none2.还有其他类似边框的例如outlinebox-shadow这两个属性都是会产生边框效果3.el-input需要更改的话–如下需要修改box-shadow为空即可上代码:deep(.el-input__wrapper){align-items:center;background-color:#F7F
- 【双语新闻】AGI安全与对齐,DeepMind近期工作
曲奇人工智能安全
agi安全llama人工智能
我们想与AF社区分享我们最近的工作总结。以下是关于我们正在做什么,为什么会这么做以及我们认为它的意义所在的一些详细信息。我们希望这能帮助人们从我们的工作基础上继续发展,并了解他们的工作如何与我们相关联。byRohinShah,SebFarquhar,AncaDragan21stAug2024AIAlignmentForumWewantedtosharearecapofourrecentoutput
- Awesome TensorFlow
weixin_30594001
人工智能移动开发大数据
AwesomeTensorFlowAcuratedlistofawesomeTensorFlowexperiments,libraries,andprojects.Inspiredbyawesome-machine-learning.WhatisTensorFlow?TensorFlowisanopensourcesoftwarelibraryfornumericalcomputationusin
- 【ShuQiHere】探索人工智能核心:机器学习的奥秘
ShuQiHere
人工智能机器学习
【ShuQiHere】什么是机器学习?机器学习(MachineLearning,ML)是人工智能(ArtificialIntelligence,AI)中最关键的组成部分之一。它使得计算机不仅能够处理数据,还能从数据中学习,从而做出预测和决策。无论是语音识别、自动驾驶还是推荐系统,背后都依赖于机器学习模型。机器学习与传统的编程不同,它不再依赖于人类编写的固定规则,而是通过数据自我改进模型,从而更灵活
- 综述论文“A Survey of Zero-Shot Learning: Settings, Methods, and Applications”
硅谷秋水
机器学习机器学习神经网络深度学习
该零样本学习综述,发表于ACMTrans.Intell.Syst.Technol.10,2,Article13(January2019)摘要:大多数机器学习方法着重于对已经在训练中看到其类别的实例进行分类。实际上,许多应用程序需要对实例进行分类,而这些实例的类以前没有见过。零样本学习(Zero-ShotLearning)是一种强大而有前途的学习范例,其中训练实例涵盖的类别与想分类的类别是不相交的。
- 机器学习 VS 表示学习 VS 深度学习
Efred.D
人工智能机器学习深度学习人工智能
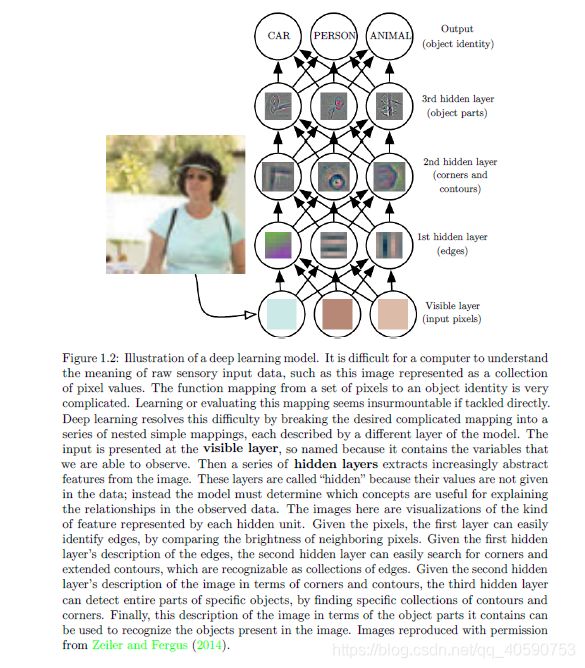
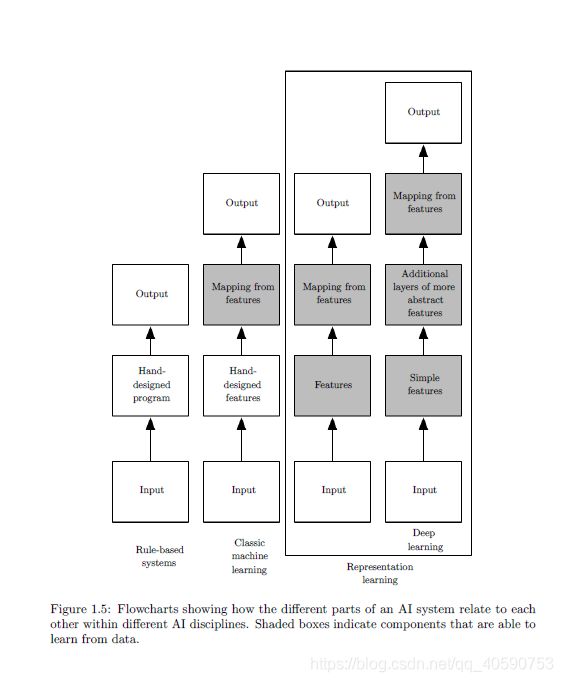
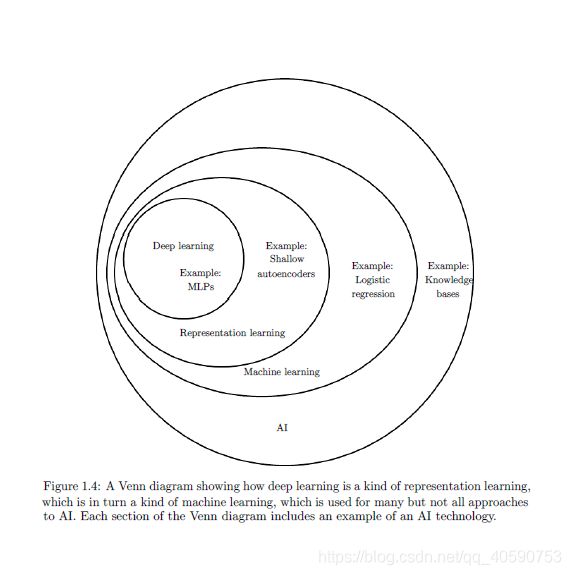
文章目录前言一、机器学习是什么?二、表示学习三、深度学习总结前言本文主要阐述机器学习,表示学习和深度学习的原理和区别.一、机器学习是什么?机器学习(machinelearning),是从有限的数据集中学习到一定的规律,再把学到的规律应用到一些相似的样本集中做预测.机器学习的历史可以追溯到20世纪40年代McCulloch提出的人工神经元网络,目前学界大致把机器学习分为传统机器学习和机器学习两个类别
- 端到端的自动驾驶论文与代码整理
大别山伧父
自动驾驶
LearningbyCheatinggithubcodearxivpaperconferenceonrobotlearning最新进展(May2021)Checkoutourlatestfollow-upwork:WorldonRails(2020)Checkoutoursubmissiontothe2020CARLAChallenge!pass
- Lt-8 Multithreading
yanlingyun0210
java
IntendedLearningOutcomesTounderstandtheconceptofconcurrency.Tounderstandthedifferenceofaprocessandathread.TodefineathreadusingtheThreadclassandRunnableinterface.TocontrolthreadswithvariousThreadmethod
- 如何使用Pytorch-Metric-Learning?
鱼儿也有烦恼
PyTorchpytorch
文章目录如何使用Pytorch-Metric-Learning?1.Pytorch-Metric-Learning库9个模块的功能1.1Sampler模块1.2Miner模块1.3Loss模块1.4Reducer模块1.5Distance模块1.6Regularizer模块1.7Trainer模块1.8Tester模块1.9Utils模块2.如何使用PyTorchMetricLearning库中的
- [Kaiming]Delving Deep into Rectifiers: Surpassing Human-Level Performance on ImageNet Classification
MTandHJ
neuralnetworks
文章目录概主要内容PReLUKaiming初始化ForwardcaseBackwardcaseHeK,ZhangX,RenS,etal.DelvingDeepintoRectifiers:SurpassingHuman-LevelPerformanceonImageNetClassification[C].internationalconferenceoncomputervision,2015:1
- 深度神经网络详解:原理、架构与应用
阿达C
活动dnn计算机网络人工智能神经网络机器学习深度学习
深度神经网络(DeepNeuralNetwork,DNN)是机器学习领域中最为重要和广泛应用的技术之一。它模仿人脑神经元的结构,通过多层神经元的连接和训练,能够处理复杂的非线性问题。在图像识别、自然语言处理、语音识别等领域,深度神经网络展示了强大的性能。本文将深入解析深度神经网络的基本原理、常见架构及其实际应用。一、深度神经网络的基本原理1.1神经元和感知器神经元是深度神经网络的基本组成单元。一个
- 前端开发需要了解的算法知识
史努比的大头
算法前端
手写深拷贝functiondeepClone(obj){//处理基础数据类型和函数if(obj===null||typeofobj!=='object'){returnobj;}//处理数组if(Array.isArray(obj)){returnobj.map(item=>deepClone(item));}//处理对象constclonedObj={};for(constkeyinobj){i
- 推荐开源项目:PyTorch-Metric-Learning
潘惟妍
推荐开源项目:PyTorch-Metric-Learningpytorch-metric-learningTheeasiestwaytousedeepmetriclearninginyourapplication.Modular,flexible,andextensible.WritteninPyTorch.项目地址:https://gitcode.com/gh_mirrors/py/pytorc
- 推荐:FastAPI驱动的稳定扩散LLMs演示项目
褚知茉Jade
推荐:FastAPI驱动的稳定扩散LLMs演示项目FastAPI-for-Machine-Learning-Live-DemoThisrepositorycontainsthefilestobuildyourveryownAIimagegenerationwebapplication!OutlinedarethecorecomponentsoftheFastAPIwebframework,anda
- 【python】【Ray的概述】
资源存储库
python开发语言
Overview概述Rayisanopen-sourceunifiedframeworkforscalingAIandPythonapplicationslikemachinelearning.Itprovidesthecomputelayerforparallelprocessingsothatyoudon’tneedtobeadistributedsystemsexpert.Rayminimi
- 什么是监督学习(Supervised Learning)
救救孩子把
AIAI学习
一、监督学习概述监督学习(SupervisedLearning)是一种极具威力的机器学习方法,能够训练算法以识别数据中的模式,并据此进行精准的预测或分类。借助已有的标记数据,监督学习模型学会了从输入到输出的映射关系,进而在各类实际问题中实现自动化决策。无论是医疗诊断、金融市场分析、客户行为预测,还是提升生产效率以及个性化推荐系统等领域,监督学习都彰显出巨大的潜力与价值。随着技术的持续进步,监督学习
- LLM系列(4):通义千问7B在Swift/DeepSpeed上微调秘诀与实战陷阱避坑指南
汀、人工智能
LLM工业级落地实践人工智能自然语言处理promptSwifiDeepSpeed通义千问Qwen
LLM系列(4):通义千问7B在Swift/DeepSpeed上微调秘诀与实战陷阱避坑指南阿里云于2023年8月3日开源通义千问70亿参数模型,包括通用模型Qwen-7B以及对话模型Qwen-7B-Chat,这也是国内首个开源自家大模型的大厂。在诸多权威大模型能力测评基准上,如MMLU、C-Eval、GSM8K、HumanEval、WMT22,通义千问7B均取得了同参数级别开源模型中的最好表现,
- 使用3DUNet训练自己的数据集(pytorch)— 医疗影像分割
编程日记✧
智能医疗pytorch人工智能python计算机视觉图像处理深度学习健康医疗
代码:lee-zq/3DUNet-Pytorch:3DUNetimplementedwithpytorch(github.com)文章<cicek16miccai.pdf(uni-freiburg.de)3DU-Net:LearningDenseVolumetricSegmentation
- 探索任务的隐秘世界:推荐Task2Vec
邓越浪Henry
探索任务的隐秘世界:推荐Task2Vecaws-cv-task2vecOfficialcodeforthepaper"Task2Vec:TaskEmbeddingforMeta-Learning"(https://arxiv.org/abs/1902.03545,ICCV2019)项目地址:https://gitcode.com/gh_mirrors/aw/aws-cv-task2vec在机器学习
- [黑洞与暗粒子]没有光的世界
comsci
无论是相对论还是其它现代物理学,都显然有个缺陷,那就是必须有光才能够计算
但是,我相信,在我们的世界和宇宙平面中,肯定存在没有光的世界....
那么,在没有光的世界,光子和其它粒子的规律无法被应用和考察,那么以光速为核心的
&nbs
- jQuery Lazy Load 图片延迟加载
aijuans
jquery
基于 jQuery 的图片延迟加载插件,在用户滚动页面到图片之后才进行加载。
对于有较多的图片的网页,使用图片延迟加载,能有效的提高页面加载速度。
版本:
jQuery v1.4.4+
jQuery Lazy Load v1.7.2
注意事项:
需要真正实现图片延迟加载,必须将真实图片地址写在 data-original 属性中。若 src
- 使用Jodd的优点
Kai_Ge
jodd
1. 简化和统一 controller ,抛弃 extends SimpleFormController ,统一使用 implements Controller 的方式。
2. 简化 JSP 页面的 bind, 不需要一个字段一个字段的绑定。
3. 对 bean 没有任何要求,可以使用任意的 bean 做为 formBean。
使用方法简介
- jpa Query转hibernate Query
120153216
Hibernate
public List<Map> getMapList(String hql,
Map map) {
org.hibernate.Query jpaQuery = entityManager.createQuery(hql);
if (null != map) {
for (String parameter : map.keySet()) {
jp
- Django_Python3添加MySQL/MariaDB支持
2002wmj
mariaDB
现状
首先,
[email protected] 中默认的引擎为 django.db.backends.mysql 。但是在Python3中如果这样写的话,会发现 django.db.backends.mysql 依赖 MySQLdb[5] ,而 MySQLdb 又不兼容 Python3 于是要找一种新的方式来继续使用MySQL。 MySQL官方的方案
首先据MySQL文档[3]说,自从MySQL
- 在SQLSERVER中查找消耗IO最多的SQL
357029540
SQL Server
返回做IO数目最多的50条语句以及它们的执行计划。
select top 50
(total_logical_reads/execution_count) as avg_logical_reads,
(total_logical_writes/execution_count) as avg_logical_writes,
(tot
- spring UnChecked 异常 官方定义!
7454103
spring
如果你接触过spring的 事物管理!那么你必须明白 spring的 非捕获异常! 即 unchecked 异常! 因为 spring 默认这类异常事物自动回滚!!
public static boolean isCheckedException(Throwable ex)
{
return !(ex instanceof RuntimeExcep
- mongoDB 入门指南、示例
adminjun
javamongodb操作
一、准备工作
1、 下载mongoDB
下载地址:http://www.mongodb.org/downloads
选择合适你的版本
相关文档:http://www.mongodb.org/display/DOCS/Tutorial
2、 安装mongoDB
A、 不解压模式:
将下载下来的mongoDB-xxx.zip打开,找到bin目录,运行mongod.exe就可以启动服务,默
- CUDA 5 Release Candidate Now Available
aijuans
CUDA
The CUDA 5 Release Candidate is now available at http://developer.nvidia.com/<wbr></wbr>cuda/cuda-pre-production. Now applicable to a broader set of algorithms, CUDA 5 has advanced fe
- Essential Studio for WinRT网格控件测评
Axiba
JavaScripthtml5
Essential Studio for WinRT界面控件包含了商业平板应用程序开发中所需的所有控件,如市场上运行速度最快的grid 和chart、地图、RDL报表查看器、丰富的文本查看器及图表等等。同时,该控件还包含了一组独特的库,用于从WinRT应用程序中生成Excel、Word以及PDF格式的文件。此文将对其另外一个强大的控件——网格控件进行专门的测评详述。
网格控件功能
1、
- java 获取windows系统安装的证书或证书链
bewithme
windows
有时需要获取windows系统安装的证书或证书链,比如说你要通过证书来创建java的密钥库 。
有关证书链的解释可以查看此处 。
public static void main(String[] args) {
SunMSCAPI providerMSCAPI = new SunMSCAPI();
S
- NoSQL数据库之Redis数据库管理(set类型和zset类型)
bijian1013
redis数据库NoSQL
4.sets类型
Set是集合,它是string类型的无序集合。set是通过hash table实现的,添加、删除和查找的复杂度都是O(1)。对集合我们可以取并集、交集、差集。通过这些操作我们可以实现sns中的好友推荐和blog的tag功能。
sadd:向名称为key的set中添加元
- 异常捕获何时用Exception,何时用Throwable
bingyingao
用Exception的情况
try {
//可能发生空指针、数组溢出等异常
} catch (Exception e) {
- 【Kafka四】Kakfa伪分布式安装
bit1129
kafka
在http://bit1129.iteye.com/blog/2174791一文中,实现了单Kafka服务器的安装,在Kafka中,每个Kafka服务器称为一个broker。本文简单介绍下,在单机环境下Kafka的伪分布式安装和测试验证 1. 安装步骤
Kafka伪分布式安装的思路跟Zookeeper的伪分布式安装思路完全一样,不过比Zookeeper稍微简单些(不
- Project Euler
bookjovi
haskell
Project Euler是个数学问题求解网站,网站设计的很有意思,有很多problem,在未提交正确答案前不能查看problem的overview,也不能查看关于problem的discussion thread,只能看到现在problem已经被多少人解决了,人数越多往往代表问题越容易。
看看problem 1吧:
Add all the natural num
- Java-Collections Framework学习与总结-ArrayDeque
BrokenDreams
Collections
表、栈和队列是三种基本的数据结构,前面总结的ArrayList和LinkedList可以作为任意一种数据结构来使用,当然由于实现方式的不同,操作的效率也会不同。
这篇要看一下java.util.ArrayDeque。从命名上看
- 读《研磨设计模式》-代码笔记-装饰模式-Decorator
bylijinnan
java设计模式
声明: 本文只为方便我个人查阅和理解,详细的分析以及源代码请移步 原作者的博客http://chjavach.iteye.com/
import java.io.BufferedOutputStream;
import java.io.DataOutputStream;
import java.io.FileOutputStream;
import java.io.Fi
- Maven学习(一)
chenyu19891124
Maven私服
学习一门技术和工具总得花费一段时间,5月底6月初自己学习了一些工具,maven+Hudson+nexus的搭建,对于maven以前只是听说,顺便再自己的电脑上搭建了一个maven环境,但是完全不了解maven这一强大的构建工具,还有ant也是一个构建工具,但ant就没有maven那么的简单方便,其实简单点说maven是一个运用命令行就能完成构建,测试,打包,发布一系列功
- [原创]JWFD工作流引擎设计----节点匹配搜索算法(用于初步解决条件异步汇聚问题) 补充
comsci
算法工作PHP搜索引擎嵌入式
本文主要介绍在JWFD工作流引擎设计中遇到的一个实际问题的解决方案,请参考我的博文"带条件选择的并行汇聚路由问题"中图例A2描述的情况(http://comsci.iteye.com/blog/339756),我现在把我对图例A2的一个解决方案公布出来,请大家多指点
节点匹配搜索算法(用于解决标准对称流程图条件汇聚点运行控制参数的算法)
需要解决的问题:已知分支
- Linux中用shell获取昨天、明天或多天前的日期
daizj
linuxshell上几年昨天获取上几个月
在Linux中可以通过date命令获取昨天、明天、上个月、下个月、上一年和下一年
# 获取昨天
date -d 'yesterday' # 或 date -d 'last day'
# 获取明天
date -d 'tomorrow' # 或 date -d 'next day'
# 获取上个月
date -d 'last month'
#
- 我所理解的云计算
dongwei_6688
云计算
在刚开始接触到一个概念时,人们往往都会去探寻这个概念的含义,以达到对其有一个感性的认知,在Wikipedia上关于“云计算”是这么定义的,它说:
Cloud computing is a phrase used to describe a variety of computing co
- YII CMenu配置
dcj3sjt126com
yii
Adding id and class names to CMenu
We use the id and htmlOptions to accomplish this. Watch.
//in your view
$this->widget('zii.widgets.CMenu', array(
'id'=>'myMenu',
'items'=>$this-&g
- 设计模式之静态代理与动态代理
come_for_dream
设计模式
静态代理与动态代理
代理模式是java开发中用到的相对比较多的设计模式,其中的思想就是主业务和相关业务分离。所谓的代理设计就是指由一个代理主题来操作真实主题,真实主题执行具体的业务操作,而代理主题负责其他相关业务的处理。比如我们在进行删除操作的时候需要检验一下用户是否登陆,我们可以删除看成主业务,而把检验用户是否登陆看成其相关业务
- 【转】理解Javascript 系列
gcc2ge
JavaScript
理解Javascript_13_执行模型详解
摘要: 在《理解Javascript_12_执行模型浅析》一文中,我们初步的了解了执行上下文与作用域的概念,那么这一篇将深入分析执行上下文的构建过程,了解执行上下文、函数对象、作用域三者之间的关系。函数执行环境简单的代码:当调用say方法时,第一步是创建其执行环境,在创建执行环境的过程中,会按照定义的先后顺序完成一系列操作:1.首先会创建一个
- Subsets II
hcx2013
set
Given a collection of integers that might contain duplicates, nums, return all possible subsets.
Note:
Elements in a subset must be in non-descending order.
The solution set must not conta
- Spring4.1新特性——Spring缓存框架增强
jinnianshilongnian
spring4
目录
Spring4.1新特性——综述
Spring4.1新特性——Spring核心部分及其他
Spring4.1新特性——Spring缓存框架增强
Spring4.1新特性——异步调用和事件机制的异常处理
Spring4.1新特性——数据库集成测试脚本初始化
Spring4.1新特性——Spring MVC增强
Spring4.1新特性——页面自动化测试框架Spring MVC T
- shell嵌套expect执行命令
liyonghui160com
一直都想把expect的操作写到bash脚本里,这样就不用我再写两个脚本来执行了,搞了一下午终于有点小成就,给大家看看吧.
系统:centos 5.x
1.先安装expect
yum -y install expect
2.脚本内容:
cat auto_svn.sh
#!/bin/bash
- Linux实用命令整理
pda158
linux
0. 基本命令 linux 基本命令整理
1. 压缩 解压 tar -zcvf a.tar.gz a #把a压缩成a.tar.gz tar -zxvf a.tar.gz #把a.tar.gz解压成a
2. vim小结 2.1 vim替换 :m,ns/word_1/word_2/gc
- 独立开发人员通向成功的29个小贴士
shoothao
独立开发
概述:本文收集了关于独立开发人员通向成功需要注意的一些东西,对于具体的每个贴士的注解有兴趣的朋友可以查看下面标注的原文地址。
明白你从事独立开发的原因和目的。
保持坚持制定计划的好习惯。
万事开头难,第一份订单是关键。
培养多元化业务技能。
提供卓越的服务和品质。
谨小慎微。
营销是必备技能。
学会组织,有条理的工作才是最有效率的。
“独立
- JAVA中堆栈和内存分配原理
uule
java
1、栈、堆
1.寄存器:最快的存储区, 由编译器根据需求进行分配,我们在程序中无法控制.2. 栈:存放基本类型的变量数据和对象的引用,但对象本身不存放在栈中,而是存放在堆(new 出来的对象)或者常量池中(字符串常量对象存放在常量池中。)3. 堆:存放所有new出来的对象。4. 静态域:存放静态成员(static定义的)5. 常量池:存放字符串常量和基本类型常量(public static f


