Matplotlib中的colorbar调整:等值线、分色个数(附完整画图代码)
随着使用画图功能越来越多,我有了这样的需求:不知道上下界的时候控制colorbar分出颜色的数量,也就是一共分几个刻度,这决定了等值线的疏密程度,非常重要。依靠函数默认值往往已经不能达到要求了。
这时,只需要把levels设置为整数,就能控制一共画几条线了
n=12
ac=ax.contourf(x,y,z,levels = n,cmap='jet',extend='both',alpha=0.75)
plt.contour(x,y,z,n,colors='k',linewidths=0.5)
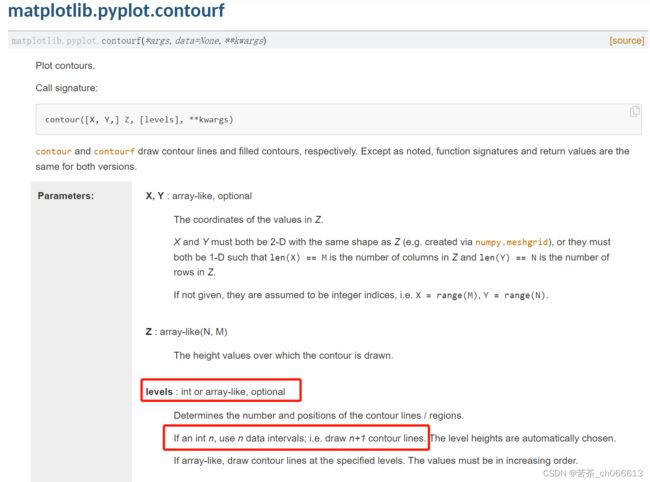
我们来看看官网的定义:
当指定levels是整数n时,会画出n+1条等值线。
问题解决。此处附完整代码如下:
import netCDF4 as nc
import matplotlib.pyplot as plt
import numpy as np

#函数profilePlot
#输入:
# 读文件路径readFile,
# 要读的变量var=temp,
# 经度还是纬度截面proType = 'lon'or'lat'
# 间隔几度画一张图proGap
# 存文件路径savePath
#
#画profile图,存到存文件路径
#输出:0

#Path是到文件夹的路径,File是到文件的路径


def profilePlot(readFile = r"D:\Oceanic Sci\data_nc_argo_grid\BOA_Argo_2004_01.nc",
                var = 'temp', proType = 'lon', proGap = 180,
                savePath = "D:\\Oceanic Sci\\img_Temp\\img_Temp_global\\img_TempProfile\\"):
    '''var='temp' or 'salt'
    '''
    tfid = nc.Dataset(readFile)
    #print(tfid.variables)
    lon = tfid.variables['lon'][:]
    lat = tfid.variables['lat'][:]
    pre = tfid.variables['pres'][:]
    var = tfid.variables[var][0,:, :, :] #units = 'degree_Celsius'
    date = readFile[-10:-3]
    #因为这里的数据只有-79.5到79.5所以去掉空白的数据,让图更加美观
    start = np.where(np.array(lat)==-79.5)[0][0]
    end = np.where(np.array(lat)==79.5)[0][0]
    lat = lat[start:end]
    var = var[:,start:end,:]
    #画图经纬度取值,及x、y轴
    lonProfile = lon[::proGap]
    latProfile = lat[::proGap]
    y = pre
    if proType == 'lon':
        pros = lonProfile
        prosAll = lon #单纯为了得到切片位置的赋值
        x = lat
    elif proType == 'lat':
        pros = latProfile
        prosAll = lat #单纯为了得到切片位置的赋值
        x = lon

    for i in pros:

        fontsize=10
        #画profile图
        fig=plt.figure(figsize=(8,3),dpi=300,constrained_layout=True)#添加画布
        plt.rcParams['axes.facecolor']='lightgrey'#画布背景设为浅灰色
        ax=fig.add_axes([0,0,1,1])#添加子图
        ax.invert_yaxis()#反转纵轴,使最大值作为起点
        #ax.set_yticks([1000,925,850,700,500,300])#突出我们感兴趣的气压层
        #取温度,需要填色的二维值
        rank = np.where(np.array(prosAll)==i)[0][0]
        if proType == 'lon':
            var0 = var[:,:,rank]
            ax.set_xticks(np.arange(-60,90,30))
            ax.set_xticklabels([r'60$^\degree$S',r'30$^\degree$S',
                                r'0$^\degree$',r'30$^\degree$N',r'60$^\degree$N']
                               ,fontsize=fontsize)
            xlabel = 'latitude'
        elif proType == 'lat':
            print('rank:',rank)
            var0 = var[:,rank,:]
            ax.set_xticks(np.arange(0,360,30))
            ax.set_xticklabels([r'180$^\degree$', r'150$^\degree$W',r'120$^\degree$W',
                                r'90$^\degree$W',r'60$^\degree$W',r'30$^\degree$W',
                                r'0$^\degree$',r'30$^\degree$E',r'60$^\degree$E',
                                r'90$^\degree$E',r'120$^\degree$E',r'150$^\degree$E']
                               ,fontsize=fontsize)#转换为纬度格式
            xlabel = 'longitude'
        #ax.set(ylim=(1200,0))#设置气压层绘图范围
        ax.set_xlabel(xlabel, fontsize=fontsize)
        ax.set_ylabel('pressure level(dbar)',fontsize=fontsize)
        ax.tick_params(axis='both',which='both',labelsize=fontsize)
        #画填色图
        apartNum = 12
        #levels = np.arange(0, 30, 2)
        ac=ax.contourf(x,y,var0,levels = apartNum,cmap='jet',extend='both',alpha=0.75)
        #画出n条线,并将颜色设置为黑色

        contour = plt.contour(x,y,var0,apartNum,colors='k',linewidths=0.5)
        #等高线上标明温度的值,颜色是黑色
        plt.clabel(contour,fmt = '%.0f',fontsize=fontsize,colors='k')
        cb=fig.colorbar(ac,extend='both',shrink=1,label='Temperature'
                        , pad=0.01)

        cb.ax.tick_params(axis='both',which='both',length=1,labelsize=fontsize)
        title = date+' '+proType+' = '+str(i)
        ax.set_title(title, fontsize=fontsize+3)
        plt.savefig(savePath+title+'.jpg',bbox_inches = 'tight')
        ##plt.savefig(savePath+title+'.jpg',constrained_layout=True)
        print(date+ proType+' = '+str(i)+'is plotted.')
    return 0
