数据可视化
原始
# 可视化爬取结果
import requests
from bs4 import BeautifulSoup  # 从bs4引入BeautifulSoup
from pyecharts import Page, Pie, Bar  # 引入绘图需要的模块

#请求网页
url = "https://movie.douban.com/cinema/later/chengdu/"
response = requests.get(url)

soup = BeautifulSoup(response.content.decode('utf-8'), 'lxml')

all_movies = soup.find('div', id="showing-soon")  # 先找到最大的div

# 先把所有的数据存到这个list里面
all_movies_info = []
for each_movie in all_movies.find_all('div', class_="item"):  # 从最大的div里面找到影片的div
    # print(each_movie)  # 输出每个影片div的内容
    all_a_tag = each_movie.find_all('a')
    all_li_tag = each_movie.find_all('li')
    movie_name = all_a_tag[1].text
    moive_href = all_a_tag[1]['href']
    movie_date = all_li_tag[0].text
    movie_type = all_li_tag[1].text
    movie_area = all_li_tag[2].text
    movie_lovers = all_li_tag[3].text.replace('人想看', '') #  去掉除了数字之外的字
    # 把电影数据添加到list
    all_movies_info.append({'name': movie_name, 'date': movie_date, 'type': movie_type,
                            'area': movie_area, 'lovers': movie_lovers})
    # print('名字:{},日期:{},类型:{},地区:{}, 关注者:{}'.format(
        # movie_name, movie_date, movie_type, movie_area, movie_lovers))
print(all_movies_info)  # 输出一下检查数据是否传递成功
关注者排行榜柱状图
# 可视化爬取结果
import requests
from bs4 import BeautifulSoup  # 从bs4引入BeautifulSoup
from pyecharts import Page, Pie, Bar  # 引入绘图需要的模块

#请求网页
url = "https://movie.douban.com/cinema/later/chengdu/"
response = requests.get(url)

soup = BeautifulSoup(response.content.decode('utf-8'), 'lxml')

all_movies = soup.find('div', id="showing-soon")  # 先找到最大的div

# 先把所有的数据存到这个list里面
all_movies_info = []
for each_movie in all_movies.find_all('div', class_="item"):  # 从最大的div里面找到影片的div
    # print(each_movie)  # 输出每个影片div的内容
    all_a_tag = each_movie.find_all('a')
    all_li_tag = each_movie.find_all('li')
    movie_name = all_a_tag[1].text
    moive_href = all_a_tag[1]['href']
    movie_date = all_li_tag[0].text
    movie_type = all_li_tag[1].text
    movie_area = all_li_tag[2].text
    movie_lovers = all_li_tag[3].text.replace('人想看', '') #  去掉除了数字之外的字
    # 把电影数据添加到list
    all_movies_info.append({'name': movie_name, 'date': movie_date, 'type': movie_type,
                            'area': movie_area, 'lovers': movie_lovers})
    # print('名字:{},日期:{},类型:{},地区:{}, 关注者:{}'.format(
        # movie_name, movie_date, movie_type, movie_area, movie_lovers))
# 绘制关注者排行榜图

# i['name'] for i in all_movies_info 这个是Python的快捷方式,
# 这一句的作用是从all_movies_info这个list里面依次取出每个元素,
# 并且取出这个元素的 name 属性
sort_by_lovers = sorted(all_movies_info, key=lambda x: int(x['lovers']))
all_names = [i['name'] for i in sort_by_lovers]
all_lovers = [i['lovers'] for i in sort_by_lovers]

lovers_rank_bar = Bar('电影关注者排行榜')  # 初始化图表,给个名字
# all_names是所有电影名,作为X轴, all_lovers是关注者的数量,作为Y轴。二者数据一一对应。
# is_convert=True设置x、y轴对调,。is_label_show=True 显示y轴值。 label_pos='right' Y轴值显示在右边
lovers_rank_bar.add('', all_names, all_lovers, is_convert=True, is_label_show=True, label_pos='right')
lovers_rank_bar  # jupyter下直接显示图表在输出框内
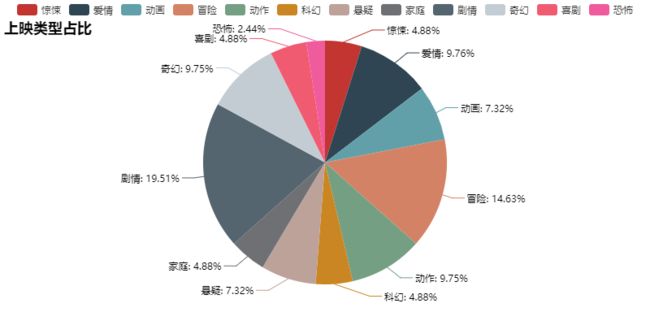
电影类型占比图
# 可视化爬取结果
import requests
from bs4 import BeautifulSoup  # 从bs4引入BeautifulSoup
from pyecharts import Page, Pie, Bar  # 引入绘图需要的模块

#请求网页
url = "https://movie.douban.com/cinema/later/chengdu/"
response = requests.get(url)

soup = BeautifulSoup(response.content.decode('utf-8'), 'lxml')

all_movies = soup.find('div', id="showing-soon")  # 先找到最大的div

# 先把所有的数据存到这个list里面
all_movies_info = []
for each_movie in all_movies.find_all('div', class_="item"):  # 从最大的div里面找到影片的div
    # print(each_movie)  # 输出每个影片div的内容
    all_a_tag = each_movie.find_all('a')
    all_li_tag = each_movie.find_all('li')
    movie_name = all_a_tag[1].text
    moive_href = all_a_tag[1]['href']
    movie_date = all_li_tag[0].text
    movie_type = all_li_tag[1].text
    movie_area = all_li_tag[2].text
    movie_lovers = all_li_tag[3].text.replace('人想看', '') #  去掉除了数字之外的字
    # 把电影数据添加到list
    all_movies_info.append({'name': movie_name, 'date': movie_date, 'type': movie_type,
                            'area': movie_area, 'lovers': movie_lovers})
    # print('名字:{},日期:{},类型:{},地区:{}, 关注者:{}'.format(
        # movie_name, movie_date, movie_type, movie_area, movie_lovers))
# 绘制电影类型占比图
all_types = [i['type'] for i in all_movies_info]
type_count = {}
for each_types in all_types:
    # 把 爱情 / 奇幻 这种分成[爱情, 奇幻]
    type_list = each_types.split(' / ')
    for e_type in type_list:
        if e_type not in type_count:
            type_count[e_type] = 1
        else:
            type_count[e_type] += 1
# print(type_count) # 检测是否数据归类成功

type_pie = Pie('上映类型占比', title_top=20)  # 因为类型过多影响标题,所以标题向下移20px
# 直接取出统计的类型名和数量并强制转换为list。
type_pie.add('', list(type_count.keys()), list(type_count.values()), is_label_show=True)
type_pie  # jupyter下直接显示
上映日期图
# 可视化爬取结果
import requests
from bs4 import BeautifulSoup  # 从bs4引入BeautifulSoup
from pyecharts import Page, Pie, Bar  # 引入绘图需要的模块

#请求网页
url = "https://movie.douban.com/cinema/later/chengdu/"
response = requests.get(url)

soup = BeautifulSoup(response.content.decode('utf-8'), 'lxml')

all_movies = soup.find('div', id="showing-soon")  # 先找到最大的div

# 先把所有的数据存到这个list里面
all_movies_info = []
for each_movie in all_movies.find_all('div', class_="item"):  # 从最大的div里面找到影片的div
    # print(each_movie)  # 输出每个影片div的内容
    all_a_tag = each_movie.find_all('a')
    all_li_tag = each_movie.find_all('li')
    movie_name = all_a_tag[1].text
    moive_href = all_a_tag[1]['href']
    movie_date = all_li_tag[0].text
    movie_type = all_li_tag[1].text
    movie_area = all_li_tag[2].text
    movie_lovers = all_li_tag[3].text.replace('人想看', '') #  去掉除了数字之外的字
    # 把电影数据添加到list
    all_movies_info.append({'name': movie_name, 'date': movie_date, 'type': movie_type,
                            'area': movie_area, 'lovers': movie_lovers})
    # print('名字:{},日期:{},类型:{},地区:{}, 关注者:{}'.format(
        # movie_name, movie_date, movie_type, movie_area, movie_lovers))
# 绘制电影上映日期柱状图
all_dates = [i['date'] for i in all_movies_info]
dates_count = {}
for date in all_dates:
    if date not in dates_count:
        dates_count[date] = 1
    else:
        dates_count[date] += 1
# print(dates_count)  # 输出验证数据是否正确

dates_bar = Bar('上映日期占比')
dates_bar.add('',list(dates_count.keys()), list(dates_count.values()), is_label_show=True)
dates_bar  # jupyter下直接显示
完整数据可视化
# 可视化爬取结果
import requests
from bs4 import BeautifulSoup  # 从bs4引入BeautifulSoup
from pyecharts import Page, Pie, Bar

#请求网页
url = "https://movie.douban.com/cinema/later/chengdu/"
response = requests.get(url)

soup = BeautifulSoup(response.content.decode('utf-8'), 'lxml')

all_movies = soup.find('div', id="showing-soon")  # 先找到最大的div

all_movies_info = []
for each_movie in all_movies.find_all('div', class_="item"):  # 从最大的div里面找到影片的div
    # print(each_movie)  # 输出每个影片div的内容
    all_a_tag = each_movie.find_all('a')
    all_li_tag = each_movie.find_all('li')
    movie_name = all_a_tag[1].text
    moive_href = all_a_tag[1]['href']
    # 运行报错 index out of range:是因为有电影没显示日期
    if len(all_li_tag) == 4:
        movie_date = all_li_tag[0].text
        movie_type = all_li_tag[1].text
        movie_area = all_li_tag[2].text
        movie_lovers = all_li_tag[3].text.replace('人想看', '')
    else:  # 网站结构改变,跟着改变代码
        movie_date = "未知"
        movie_type = all_li_tag[0].text
        movie_area = all_li_tag[1].text
        movie_lovers = all_li_tag[2].text.replace('人想看', '')
    all_movies_info.append({'name': movie_name, 'date': movie_date, 'type': movie_type,
                            'area': movie_area, 'lovers': movie_lovers})
    # print('名字:{},日期:{},类型:{},地区:{}, 关注者:{}'.format(
        # movie_name, movie_date, movie_type, movie_area, movie_lovers))
# print(all_movies_info)  # 输出一下检查数据是否传递成功

page = Page() # 同一个网页显示多个图

# 绘制关注者排行榜图

# i['name'] for i in all_movies_info 这个是Python的快捷方式
# 这一句的作用是从all_movies_info这个list里面依次取出每个元素,
# 并且取出这个元素的 name 属性
sort_by_lovers = sorted(all_movies_info, key=lambda x: int(x['lovers']))
all_names = [i['name'] for i in sort_by_lovers]
all_lovers = [i['lovers'] for i in sort_by_lovers]
lovers_rank_bar = Bar('电影关注者排行榜')
lovers_rank_bar.add('', all_names, all_lovers, is_convert=True, is_label_show=True, label_pos='right')
page.add(lovers_rank_bar)

# lovers_rank_bar

# 绘制电影类型占比图
all_types = [i['type'] for i in all_movies_info]
type_count = {}
for each_types in all_types:
    # 把 爱情 / 奇幻 这种分成[爱情, 奇幻]
    type_list = each_types.split(' / ')
    for e_type in type_list:
        if e_type not in type_count:
            type_count[e_type] = 1
        else:
            type_count[e_type] += 1
# print(type_count) # 检测是否数据归类成功

type_pie = Pie('上映类型占比', title_top=20)
type_pie.add('', list(type_count.keys()), list(type_count.values()), is_label_show=True)
# type_pie

page.add(type_pie)

# 绘制电影上映日期柱状图
all_dates = [i['date'] for i in all_movies_info]
dates_count = {}
for date in all_dates:
    if date not in dates_count:
        dates_count[date] = 1
    else:
        dates_count[date] += 1
# print(dates_count)  # 输出验证数据是否正确

dates_bar = Bar('上映日期占比')
dates_bar.add('',list(dates_count.keys()), list(dates_count.values()), is_label_show=True)
# dates_bar

page.add(dates_bar)

page  # jupyter下自动显示
数据分析
- 关注者排行榜图里,网络迷踪,12.14上映,美国犯罪嫌疑剧情片,关注人数123710;狗十三,12.07上映,大陆家庭剧情片,关注人数106787;龙猫,12.14上映,日漫,关注人数98370;这三部电影的受欢迎度远远超过其他电影,最受大众期待‘
- 上映电影类型图里,最多的是剧情类,其次是爱情和喜剧。
- 上映日期也表明了,12月14日上映的电影最多,其中最受欢迎的两部网络迷踪和龙猫就在当天上映。
- 龙猫 如果你在下雨天的车站,遇到被淋湿的妖怪,请把雨伞借给它,你会得到森林的通行证哦