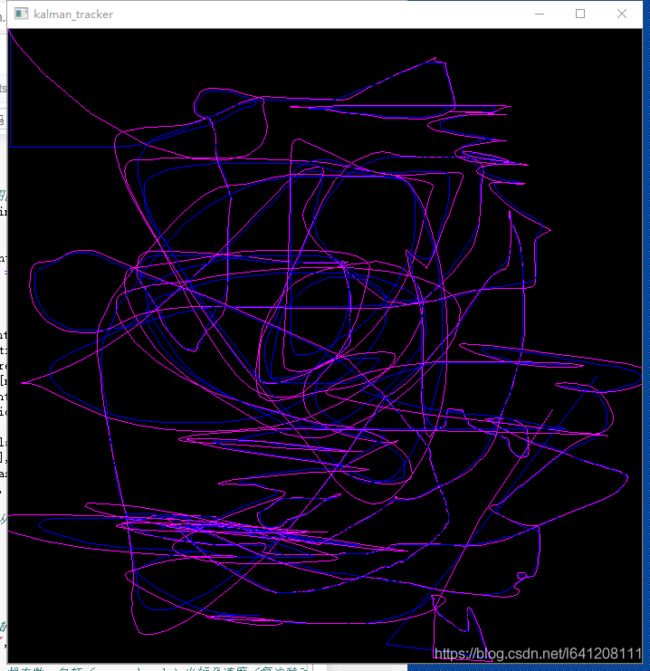
#creater:ljj
import cv2
import numpy as np

# 创建一个空帧,定义(700, 700, 3)画图区域
frame = np.zeros((700, 700, 3), np.uint8)

# 初始化测量坐标和鼠标运动预测的数组
last_measurement = current_measurement = np.array((2, 1), np.float32)
last_prediction = current_prediction = np.zeros((2, 1), np.float32)

# 定义鼠标回调函数,用来绘制跟踪结果
def mousemove(event, x, y, s, p):
    global frame, current_measurement, measurements, last_measurement, current_prediction, last_prediction
    last_prediction = current_prediction # 把当前预测存储为上一次预测
    last_measurement = current_measurement # 把当前测量存储为上一次测量
    current_measurement = np.array([[np.float32(x)], [np.float32(y)]]) # 当前测量
    kalman.correct(current_measurement) # 用当前测量来校正卡尔曼滤波器
    current_prediction = kalman.predict() # 计算卡尔曼预测值,作为当前预测

    lmx, lmy = last_measurement[0], last_measurement[1] # 上一次测量坐标
    cmx, cmy = current_measurement[0], current_measurement[1] # 当前测量坐标
    lpx, lpy = last_prediction[0], last_prediction[1] # 上一次预测坐标
    cpx, cpy = current_prediction[0], current_prediction[1] # 当前预测坐标

    # 绘制从上一次测量到当前测量以及从上一次预测到当前预测的两条线
    cv2.line(frame, (lmx, lmy), (cmx, cmy), (255, 0, 0)) # 蓝色线为测量值
    cv2.line(frame, (lpx, lpy), (cpx, cpy), (255, 0, 255)) # 粉色线为预测值

# 窗口初始化
cv2.namedWindow("kalman_tracker")

# opencv采用setMouseCallback函数处理鼠标事件,具体事件必须由回调(事件)函数的第一个参数来处理,该参数确定触发事件的类型(点击、移动等)
cv2.setMouseCallback("kalman_tracker", mousemove)

kalman = cv2.KalmanFilter(4, 2) # 4:状态数,包括(x,y,dx,dy)坐标及速度(每次移动的距离);2:观测量,能看到的是坐标值
kalman.measurementMatrix = np.array([[1, 0, 0, 0], [0, 1, 0, 0]], np.float32) # 系统测量矩阵
kalman.transitionMatrix = np.array([[1, 0, 1, 0], [0, 1, 0, 1], [0, 0, 1, 0], [0, 0, 0, 1]], np.float32) # 状态转移矩阵
kalman.processNoiseCov = np.array([[1, 0, 0, 0], [0, 1, 0, 0], [0, 0, 1, 0], [0, 0, 0, 1]], np.float32)*0.03 # 系统过程噪声协方差

while True:
    cv2.imshow("kalman_tracker", frame)
    key = cv2.waitKey(1) & 0xFF
    if key == ord('q'):
        break
cv2.destroyAllWindows()

