MATLAB插值函数interp1
MATLAB插值函数interp1
参考链接:interp1
插值法又称“内插法”,是利用函数f (x)在某区间中已知的若干点的函数值,作出适当的特定函数,在区间的其他点上用这特定函数的值作为函数f (x)的近似值,这种方法称为插值法。如果这特定函数是多项式,就称它为插值多项式。
函数使用基本形式:
yq = interp1(x, y, xq, method, extrapolation)
- x和y为已知输入样本;
- xq为需要预测的自变量序列,yq为相对应预测的变量序列;
- method为插值方法,包括’linear’、‘nearest’、‘next’、‘previous’、‘pchip’、‘cubic’、‘v5cubic’、‘makima’ 或 ‘spline’。默认方法为 ‘linear’;
- extrapolation为外插相关设置。来计算落在 x 域范围外的点。如果希望使用 method 算法进行外插,可将 extrapolation 设置为 ‘extrap’。您也可以指定一个标量值,这种情况下,interp1 将为所有落在 x 域范围外的点返回该标量值。
注意:所有的插值方法都要求x是单调的,并且xi不能够超过x的范围。
举例1:
%{
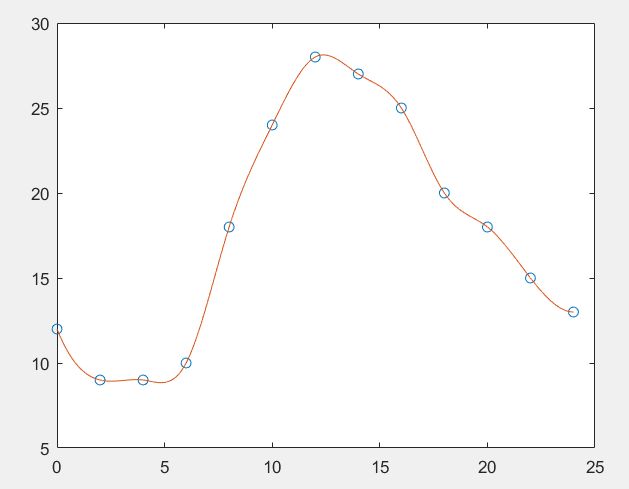
    例如:在一 天24小时内,从零点开始每间隔2小时测得的环境温度数据分别为
            12,9,9,1,0,18 ,24,28,27,25,20,18,15,13,
    推测中午12点(即13点)时的温度.
%}
x = 0:2:24;
y = [12   9   9   10   18  24   28   27   25   20  18  15  13];
a = 13;
y1 = interp1(x,y,a,'spline')
% 结果为:  27.8725

% 若要得到一天24小时的温度曲线,则:
xi = 0:1/3600:24;
% 插值点可以是向量,则返回的也就是对应的向量
yi = interp1(x,y,xi, 'spline');
plot(x,y,'o' ,xi,yi);
举例2:基于粗略采样的正弦函数进行插值
clear
clc

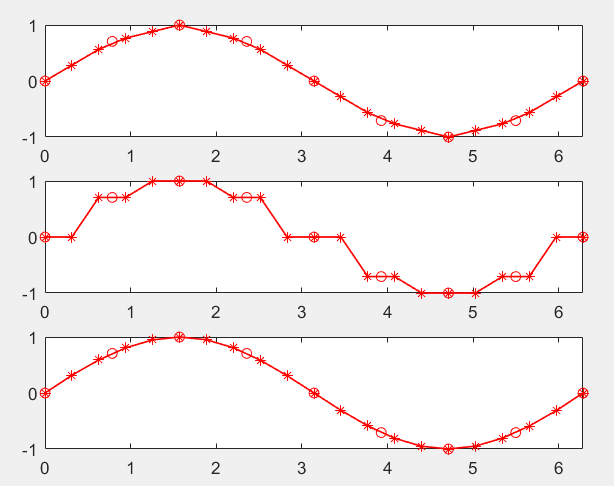
x = 0:pi/4:2*pi;%一个正弦函数
y = sin(x);
xq = 0:pi/10:2*pi;%将查询点定义为 x 范围内更精细的采样点。

figure
yq1 = interp1(x,y,xq); % 线性
yq2 = interp1(x,y,xq,'nearest'); % 邻近
yq3 = interp1(x,y,xq,'spline'); % 三次样条

subplot(3,1,1);
plot(x,y,'ro',xq,yq1,'r-*','LineWidth',1);
xlim([0 2*pi]);
subplot(3,1,2);
plot(x,y,'ro',xq,yq2,'r-*','LineWidth',1);
xlim([0 2*pi]);
subplot(3,1,3);
plot(x,y,'ro',xq,yq3,'r-*','LineWidth',1);
xlim([0 2*pi]);
举例3:在不指定样本点的情况下进行插值
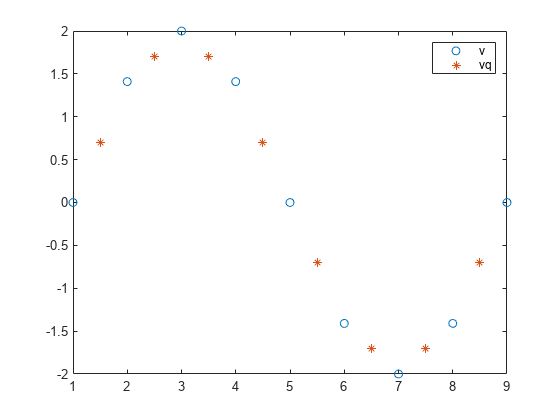
v = [0  1.41  2  1.41  0  -1.41  -2  -1.41 0];%定义一组函数值。
xq = 1.5:8.5;%定义一组介于默认点 1:9 之间的查询点。在这种情况下,默认点为 1:9,因为 v 包含 9 个值。
vq = interp1(v,xq);%计算 xq 处的 v

figure
plot((1:9),v,'o',xq,vq,'*');
legend('v','vq');
x = [1 2 3 4 5];
v = [12 16 31 10 6];

xq = [0 0.5 1.5 5.5 6 8 10];%指定查询点 xq,这些查询点延伸到 x 的定义域以外。
vq1 = interp1(x,v,xq,'pchip');
vq2 = interp1(x,v,xq,'linear');
vq3 = interp1(x,v,xq,'linear','extrap');
结果:

‘pchip’ 默认外插,但 ‘linear’ 不会。
举例5:
x = 0:2*pi;
y = sin(x);
xx = 0:0.5:2*pi;

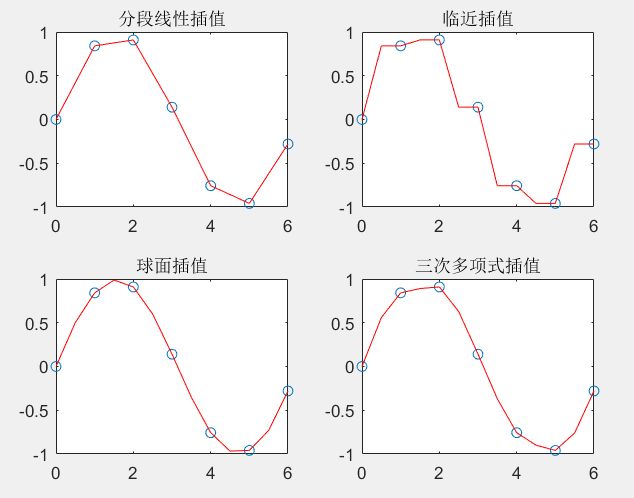
% interp1对sin函数进行分段线性插值,调用interp1的时候,默认的是分段线性插值
y1 = interp1(x,y,xx,'linear');
subplot(2,2,1);
plot(x,y,'o',xx,y1,'r')
title('分段线性插值')

% 临近插值
y2 = interp1(x,y,xx,'nearest');
subplot(2,2,2);
plot(x,y,'o',xx,y2,'r');
title('临近插值')

%球面线性插值
y3 = interp1(x,y,xx,'spline');
subplot(2,2,3);
plot(x,y,'o',xx,y3,'r')
title('球面插值')

%三次多项式插值法
y4 = interp1(x,y,xx,'pchip');
subplot(2,2,4);
plot(x,y,'o',xx,y4,'r');
title('三次多项式插值')


