Python实现分类器性能度量(混淆矩阵,正确率,准确率,召回率,ROC,AUC)
1.混淆矩阵
对于二分类问题,可将样例根据其真实类别与分类器预测类别的组合划分为:
真正例(true positive):将一个正例正确判断为正例
假正例(false positive):将一个反例错误判断为正例
真反例(true negative):将一个反例正确判断为反例
假反例(false negative):将一个正例错误判断为反例
令TP、FP、TN、FN分别表示对应的样例数,这四个指标构成了分类结果的混淆矩阵:
| 正例(预测结果) | 反例(预测结果) | |
| 正例(真实情况) | TP(真正例) | FN(假反例) |
| 反例(真实情况) | FP(假正例) | TN(真反例) |
样例总数 = TP + FP + TN + FN
2.正确率(accuracy)
即分类正确的样本数占样本总数的比例:
accuracy = (TP + TN) / (TP + FP + TN + FN)
3.准确率(precision)
即预测为正例的样本中真正为正例的比例:
precision = TP / (TP + FP)
4.召回率(recall)
也称检出率,即真正为正例的样本中正确预测为正例的比例:
recall = TP / (TP + FN)
5.ROC
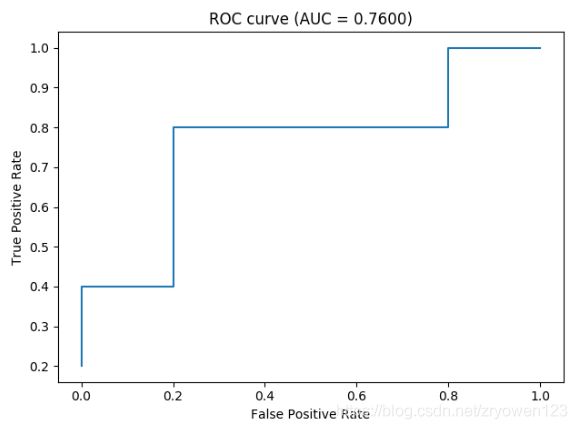
ROC全称“受试者工作特征”曲线。我们根据机器学习的预测评分结果对样例进行排序,按此顺序逐个把样本的分值作为检查为正例的阈值进行预测,计算得到两个重要的指标:真正例率(True Positive Rate, TPR)、假正例率(False Positive Rate, FPR)。以TPR为纵轴,FPR为横轴做图,就得到了“ROC”曲线。
TPR = TP / (TP + FN)
FPR = FP / (TN + FP)
6.AUC
AUC即为ROC曲线下的面积
7.Python实现
import numpy as np
import matplotlib.pyplot as plt


class Performance:
    """
    定义一个类,用来分类器的性能度量
    """
    def __init__(self, labels, scores, threshold=0.5):
        """
        :param labels:数组类型,真实的标签
        :param scores:数组类型,分类器的得分
        :param threshold:检测阈值
        """
        self.labels = labels
        self.scores = scores
        self.threshold = threshold
        self.db = self.get_db()
        self.TP, self.FP, self.FN, self.TN = self.get_confusion_matrix()

    def accuracy(self):
        """
        :return: 正确率
        """
        return (self.TP + self.TN) / (self.TP + self.FN + self.FP + self.TN)

    def presision(self):
        """
        :return: 准确率
        """
        return self.TP / (self.TP + self.FP)

    def recall(self):
        """
        :return: 召回率
        """
        return self.TP / (self.TP + self.FN)

    def auc(self):
        """
        :return: auc值
        """
        auc = 0.
        prev_x = 0
        xy_arr = self.roc_coord()
        for x, y in xy_arr:
            if x != prev_x:
                auc += (x - prev_x) * y
                prev_x = x
        return auc

    def roc_coord(self):
        """
        :return: roc坐标
        """
        xy_arr = []
        tp, fp = 0., 0.
        neg = self.TN + self.FP
        pos = self.TP + self.FN
        for i in range(len(self.db)):
            tp += self.db[i][0]
            fp += 1 - self.db[i][0]
            xy_arr.append([fp / neg, tp / pos])
        return xy_arr

    def roc_plot(self):
        """
        画roc曲线
        :return:
        """
        auc = self.auc()
        xy_arr = self.roc_coord()
        x = [_v[0] for _v in xy_arr]
        y = [_v[1] for _v in xy_arr]
        plt.title("ROC curve (AUC = %.4f)" % auc)
        plt.ylabel("True Positive Rate")
        plt.xlabel("False Positive Rate")
        plt.plot(x, y)
        plt.show()

    def get_db(self):
        db = []
        for i in range(len(self.labels)):
            db.append([self.labels[i], self.scores[i]])
        db = sorted(db, key=lambda x: x[1], reverse=True)
        return db

    def get_confusion_matrix(self):
        """
        计算混淆矩阵
        :return:
        """
        tp, fp, fn, tn = 0., 0., 0., 0.
        for i in range(len(self.labels)):
            if self.labels[i] == 1 and self.scores[i] >= self.threshold:
                tp += 1
            elif self.labels[i] == 0 and self.scores[i] >= self.threshold:
                fp += 1
            elif self.labels[i] == 1 and self.scores[i] < self.threshold:
                fn += 1
            else:
                tn += 1
        return [tp, fp, fn, tn]
测试一下:
if __name__ == '__main__':
    labels = np.array([1, 1, 0, 1, 1, 0, 0, 0, 1, 0])
    scores = np.array([0.9, 0.8, 0.7, 0.6, 0.55, 0.54, 0.53, 0.51, 0.5, 0.4])
    p = Performance(labels, scores)
    acc = p.accuracy()
    pre = p.presision()
    rec = p.recall()
    print('accuracy: %.2f' % acc)
    print('precision: %.2f' % pre)
    print('recall: %.2f' % rec)
    p.roc_plot()
结果为:
accuracy: 0.60
precision: 0.56
recall: 1.00
