传统机器学习(二)逻辑回归算法(一)
传统机器学习(二)逻辑回归算法(一)
1.1 算法概述
1.1.1 逻辑回归及其梯度推导
线性回归的任务,就是构造一个预测函数来映射输入的特征矩阵x和标签值y的线性关系,而构造预测函数的核心就是找出模型的参数,著名的最小二乘法就是用来求解线性回归中参数的数学方法。
通过函数z,线性回归使用输入的特征矩阵X来输出一组连续型的标签值y_pred,以完成各种预测连续型变量的任务(比如预测产品销量,预测股价等等)。那如果我们的标签是离散型变量,尤其是,如果是满足0-1分布的离散型变量,我们要怎么办呢?
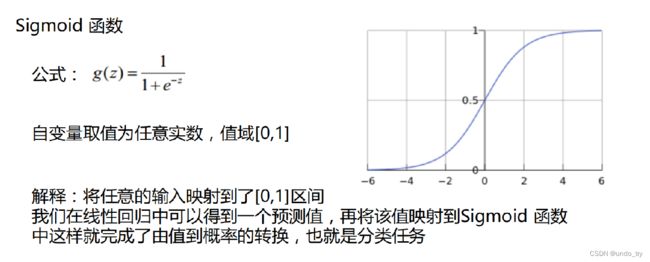
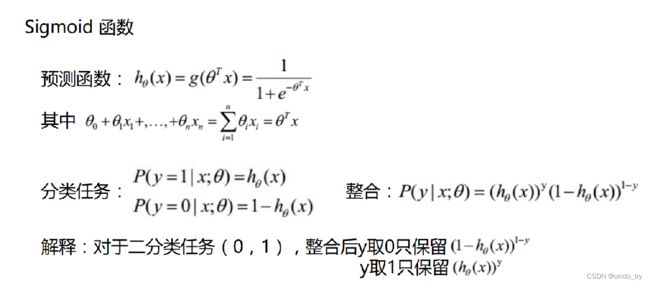
我们可以通过引入联系函数(link function),将线性回归方程z变换为g(z),并且令g(z)的值分布在(0,1)之间,且当g(z)接近0时样本的标签为类别0,当g(z)接近1时样本的标签为类别1,这样就得到了一个分类模型。而这个联系函数对于逻辑回归来说,就是Sigmoid函数。
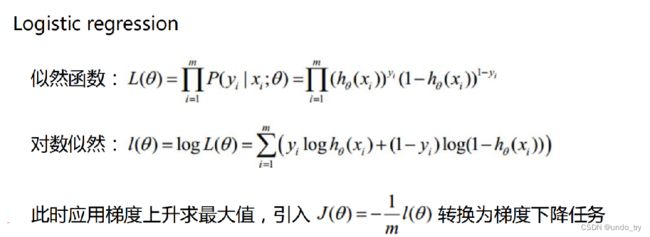
梯度公式推导
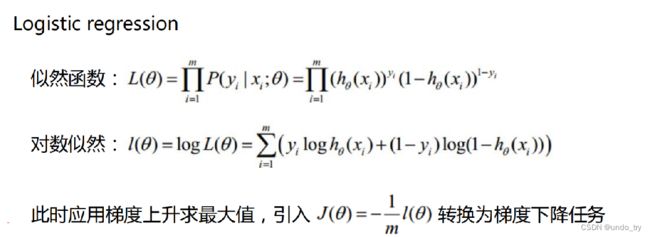
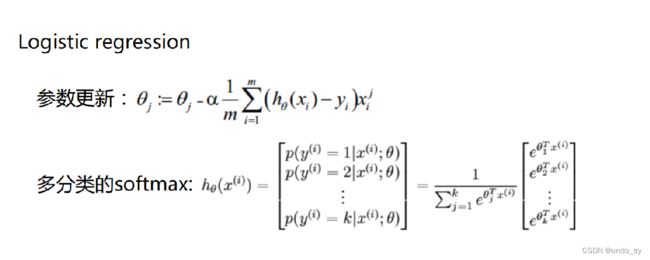
参数更新
1.1.2 逻辑回归的优点
-
逻辑回归对线性关系的拟合效果好,特征与标签之间的线性关系极强的数据。比如金融领域中的信用卡欺诈,评分卡制作,电商中的营销预测等等相关的数据,都是逻辑回归的强项。虽然现在有了梯度提升树GDBT,比逻辑回归效果更好,也被许多数据咨询公司启用,但逻辑回归在金融领域,尤其是银行业中的统治地位依然不可动摇(相对的,逻辑回归在非线性数据的效果很多时候比瞎猜还不如,所以如果你已经知道数据之间的联系是非线性的,千万不要迷信逻辑回归)。
-
逻辑回归计算快:对于线性数据,逻辑回归的拟合和计算都非常快,计算效率优于SVM和随机森林。
-
逻辑回归返回的分类结果不是固定的0,1,而是以小数形式呈现的类概率数字。我们因此可以把逻辑回归返回的结果当成连续型数据来利用。比如在评分卡制作时,我们不仅需要判断客户是否会违约,还需要给出确定的”信用分“,而这个信用分的计算就需要使用类概率计算出的对数几率,而决策树和随机森林这样的分类器,可以产出分类结果,却无法帮助我们计算分数(当然,在sklearn中,决策树也可以产生概率,使用接口predict_proba调用就好,但一般来说,正常的决策树没有这个功能)。
-
另外,逻辑回归还有抗噪能力强的优点。并且,逻辑回归在小数据集上表现更好,在大型的数据集上,树模型有着更好的表现。
1.2 python代码手动实现逻辑回归
1.2.1 手动实现逻辑回归
import numpy as np
from scipy.optimize import minimize
from utils.features import prepare_for_training
from utils.hypothesis import sigmoid


class LogisticRegression:
    def __init__(self, data, labels, poly_degree = 0, sinusoid_degree = 0, normalize_data = False):
        """
                1.对数据进行预处理操作
                2.先得到所有的特征个数
                3.初始化参数矩阵
        """
        (data_processed,
         features_mean,
         features_deviation) = prepare_for_training(data,poly_degree,sinusoid_degree,normalize_data)

        self.data = data_processed
        self.labels = labels
        self.unique_labels = np.unique(labels) # 标签的种类
        self.features_mean = features_mean
        self.features_deviation = features_deviation
        self.polynomial_degree = poly_degree
        self.sinusoid_degree = sinusoid_degree
        self.normalize_data = normalize_data

        num_features = self.data.shape[1]  # 训练数据特征数量
        num_unique_labels = np.unique(labels).shape[0]  # 标签的数量
        # 初始化theta,因为可能是多分类,因此将其拆分为多个2分类,每一个2分类都有shape为(num_features, 1)的theta
        self.theta = np.zeros((num_unique_labels, num_features))


    def train(self,max_epochs=500):
        cost_histories = []
        num_features = self.data.shape[1]
        # 遍历每一个标签,将等于当前标签的转换为1,其他标签转换为0
        # 将多分类问题转换为2分类问题
        for label_index, unique_label in enumerate(self.unique_labels):
            # 当前2分类的标签
            current_labels = (self.labels == unique_label).astype(float)
            # 当前2分类theta的初始化
            current_initial_theta = np.copy(self.theta[label_index].reshape(num_features, 1))
            # 利用梯度下降得到最终的theta值
            (current_theta, cost_history) = LogisticRegression.gradient_descent(self.data, current_labels,
                                                                                current_initial_theta, max_epochs)
            self.theta[label_index] = current_theta.T
            cost_histories.append(cost_history)

        return self.theta,cost_histories


    @staticmethod
    def gradient_descent(data,labels,current_initial_theta,max_epochs):
        cost_history = []
        num_features = data.shape[1]
        result = minimize(
            # 要优化的目标:
            lambda current_theta: LogisticRegression.cost_function(data, labels,
                                                                   current_theta.reshape(num_features, 1)),
            # 初始化的权重参数
            current_initial_theta,
            # 选择优化策略
            method='CG',
            # 梯度下降迭代计算公式
            jac=lambda current_theta: LogisticRegression.gradient_step(data, labels,
                                                                       current_theta.reshape(num_features, 1)),
            # 记录结果
            callback=lambda current_theta: cost_history.append(
                LogisticRegression.cost_function(data, labels, current_theta.reshape((num_features, 1)))),
            # 迭代次数
            options={'maxiter': max_epochs}
        )
        if not result.success:
            raise ArithmeticError('Can not minimize cost function' + result.message)
        optimized_theta = result.x.reshape(num_features, 1)
        return optimized_theta, cost_history

    @staticmethod
    def cost_function(data, labels, theta):
        num_examples = data.shape[0]
        # 预测值
        predictions = LogisticRegression.hypothesis(data, theta)
        # 交叉熵损失
        y_is_set_cost = np.dot(labels[labels == 1].T, np.log(predictions[labels == 1]))
        y_is_not_set_cost = np.dot(1 - labels[labels == 0].T, np.log(1 - predictions[labels == 0]))
        cost = (-1 / num_examples) * (y_is_set_cost + y_is_not_set_cost)
        return cost

    @staticmethod
    def hypothesis(data, theta):
        # 预测值(先进行线性变化,然后代入sigmod函数)
        predictions = sigmoid(np.dot(data, theta))
        return predictions

    @staticmethod
    def gradient_step(data,labels,theta):
        num_examples = labels.shape[0]
        # 预测值
        predictions = LogisticRegression.hypothesis(data,theta)
        # 误差
        label_diff = predictions - labels
        # 梯度值
        gradients = (1/num_examples) * np.dot(data.T, label_diff)
        return gradients.T.flatten()

    def predict(self, data):
        num_examples = data.shape[0]
        # 数据预处理
        data_processed = prepare_for_training(data, self.polynomial_degree, self.sinusoid_degree, self.normalize_data)[0]
        # 预测值
        prob = LogisticRegression.hypothesis(data_processed, self.theta.T)
        # 找出概率最大的索引
        max_prob_index = np.argmax(prob, axis=1)
        # 得出预测样本最大索引所属的类别
        class_prediction = np.empty(max_prob_index.shape, dtype=object)
        for index, label in enumerate(self.unique_labels):
            class_prediction[max_prob_index == index] = label
        return class_prediction.reshape((num_examples, 1))
工具包utils类
"""Prepares the dataset for training"""

import numpy as np
from .normalize import normalize
from .generate_sinusoids import generate_sinusoids
from .generate_polynomials import generate_polynomials


def prepare_for_training(data, polynomial_degree=0, sinusoid_degree=0, normalize_data=True):

    # 计算样本总数
    num_examples = data.shape[0]

    data_processed = np.copy(data)

    # 预处理
    features_mean = 0
    features_deviation = 0
    data_normalized = data_processed
    if normalize_data:
        (
            data_normalized,
            features_mean,
            features_deviation
        ) = normalize(data_processed)

        data_processed = data_normalized

    # 特征变换sinusoidal
    if sinusoid_degree > 0:
        sinusoids = generate_sinusoids(data_normalized, sinusoid_degree)
        data_processed = np.concatenate((data_processed, sinusoids), axis=1)

    # 特征变换polynomial
    if polynomial_degree > 0:
        polynomials = generate_polynomials(data_normalized, polynomial_degree, normalize_data)
        data_processed = np.concatenate((data_processed, polynomials), axis=1)

    # 加一列1
    data_processed = np.hstack((np.ones((num_examples, 1)), data_processed))

    return data_processed, features_mean, features_deviation
normalize类
"""Normalize features"""

import numpy as np


def normalize(features):

    features_normalized = np.copy(features).astype(float)

    # 计算均值
    features_mean = np.mean(features, 0)

    # 计算标准差
    features_deviation = np.std(features, 0)

    # 标准化操作
    if features.shape[0] > 1:
        features_normalized -= features_mean

    # 防止除以0
    features_deviation[features_deviation == 0] = 1
    features_normalized /= features_deviation

    return features_normalized, features_mean, features_deviation
generate_sinusoids类
import numpy as np


def generate_sinusoids(dataset, sinusoid_degree):
    """
    sin(x).
    """

    num_examples = dataset.shape[0]
    sinusoids = np.empty((num_examples, 0))

    for degree in range(1, sinusoid_degree + 1):
        sinusoid_features = np.sin(degree * dataset)
        sinusoids = np.concatenate((sinusoids, sinusoid_features), axis=1)

    return sinusoids
generate_polynomials类
"""Add polynomial features to the features set"""

import numpy as np
from .normalize import normalize


def generate_polynomials(dataset, polynomial_degree, normalize_data=False):
    """变换方法:
    x1, x2, x1^2, x2^2, x1*x2, x1*x2^2, etc.
    """

    features_split = np.array_split(dataset, 2, axis=1)
    dataset_1 = features_split[0]
    dataset_2 = features_split[1]

    (num_examples_1, num_features_1) = dataset_1.shape
    (num_examples_2, num_features_2) = dataset_2.shape

    if num_examples_1 != num_examples_2:
        raise ValueError('Can not generate polynomials for two sets with different number of rows')

    if num_features_1 == 0 and num_features_2 == 0:
        raise ValueError('Can not generate polynomials for two sets with no columns')

    if num_features_1 == 0:
        dataset_1 = dataset_2
    elif num_features_2 == 0:
        dataset_2 = dataset_1

    num_features = num_features_1 if num_features_1 < num_examples_2 else num_features_2
    dataset_1 = dataset_1[:, :num_features]
    dataset_2 = dataset_2[:, :num_features]

    polynomials = np.empty((num_examples_1, 0))

    for i in range(1, polynomial_degree + 1):
        for j in range(i + 1):
            polynomial_feature = (dataset_1 ** (i - j)) * (dataset_2 ** j)
            polynomials = np.concatenate((polynomials, polynomial_feature), axis=1)

    if normalize_data:
        polynomials = normalize(polynomials)[0]

    return polynomials
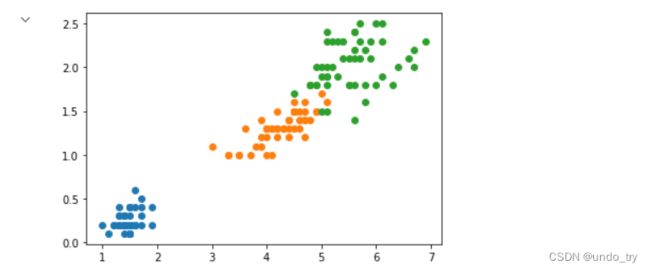
1.2.2 逻辑回归在线性可分的鸢尾花数据集上的应用
import numpy as np
import pandas as pd
# 导入画图模块
import matplotlib.pyplot as plt
%matplotlib inline
# 导入手动实现的逻辑回归
from logistic_regression import LogisticRegression


data = pd.read_csv('./data/iris.csv')
iris_types = ['SETOSA','VERSICOLOR','VIRGINICA']

x_axis = 'petal_length'
y_axis = 'petal_width'


# 绘制原始分类图像
for iris_type in iris_types:
    plt.scatter(data[x_axis][data['class']==iris_type],
                data[y_axis][data['class']==iris_type],
                label = iris_type
                )
plt.show()
# 准备训练数据
num_examples = data.shape[0]
x_train = data[[x_axis,y_axis]].values.reshape((num_examples,2))
y_train = data['class'].values.reshape((num_examples,1))


# 初始化参数,不进行多项式准换以及数据标准化
polynomial_degree = 0
sinusoid_degree = 0

logistic_regression = LogisticRegression(x_train,y_train,polynomial_degree,sinusoid_degree)
labels = logistic_regression.unique_labels
thetas,cost_histories = logistic_regression.train()

# 绘制图像
plt.plot(range(len(cost_histories[0])),cost_histories[0],label = labels[0])
plt.plot(range(len(cost_histories[1])),cost_histories[1],label = labels[1])
plt.plot(range(len(cost_histories[2])),cost_histories[2],label = labels[2])
plt.legend()
plt.show()
# 计算准确率
y_train_precs = logistic_regression.predict(x_train)
precision = np.sum(y_train_precs == y_train) / y_train.shape[0] * 100
print ('precision:',precision)

# precision: 96.0
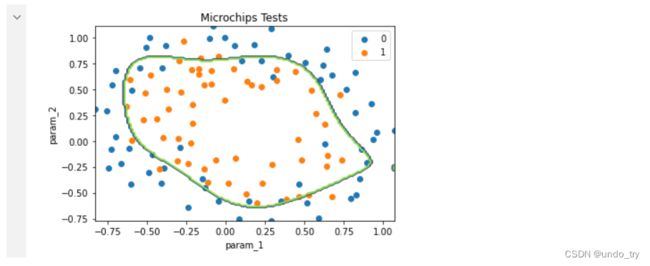
1.2.3 逻辑回归在线性不可分数据集上的应用
import numpy as np
import pandas as pd
import matplotlib.pyplot as plt
import math
%matplotlib inline
# 导入手写的逻辑回归
from logistic_regression import LogisticRegression


data = pd.read_csv('./data/microchips-tests.csv')

# 选择两个特征
x_axis = 'param_1'
y_axis = 'param_2'


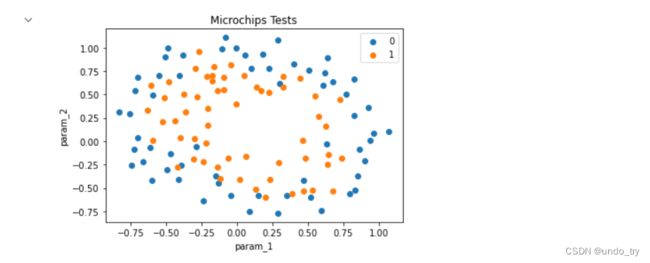
# 散点图
plt.scatter(
        data[x_axis][data['validity'] == 0],
        data[y_axis][data['validity'] == 0],
        label=0
    )

plt.scatter(
        data[x_axis][data['validity'] == 1],
        data[y_axis][data['validity'] == 1],
        label=1
    )
plt.xlabel(x_axis)
plt.ylabel(y_axis)
plt.title('Microchips Tests')
plt.legend()
plt.show()
# 准备训练数据
num_examples = data.shape[0]
x_train = data[[x_axis, y_axis]].values.reshape((num_examples, 2))
y_train = data['validity'].values.reshape((num_examples, 1))


# 训练参数
max_epochs = 100000
regularization_param = 0
polynomial_degree = 5  # 开启多项式变换
sinusoid_degree = 0

# 逻辑回归
logistic_regression = LogisticRegression(x_train, y_train, polynomial_degree, sinusoid_degree)
# 训练
(thetas, costs) = logistic_regression.train(max_epochs)


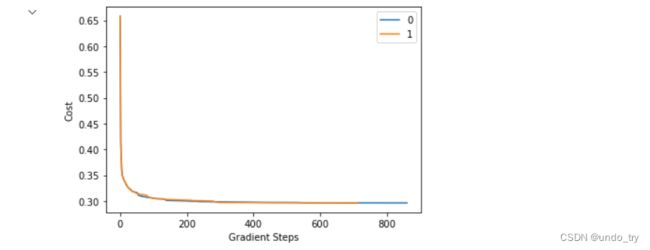
# 训练结果 绘图展示
labels = logistic_regression.unique_labels

plt.plot(range(len(costs[0])), costs[0], label=labels[0])
plt.plot(range(len(costs[1])), costs[1], label=labels[1])

plt.xlabel('Gradient Steps')
plt.ylabel('Cost')
plt.legend()
plt.show()
# 预测
y_train_predictions = logistic_regression.predict(x_train)

# 准确率
precision = np.sum(y_train_predictions == y_train) / y_train.shape[0] * 100

print('Training Precision: {:5.4f}%'.format(precision))
# Training Precision: 88.9831%
# 展示结果图
num_examples = x_train.shape[0]
samples = 150
x_min = np.min(x_train[:, 0])
x_max = np.max(x_train[:, 0])

y_min = np.min(x_train[:, 1])
y_max = np.max(x_train[:, 1])

X = np.linspace(x_min, x_max, samples)
Y = np.linspace(y_min, y_max, samples)
Z = np.zeros((samples, samples))

# 结果展示
for x_index, x in enumerate(X):
    for y_index, y in enumerate(Y):
        data = np.array([[x, y]])
        Z[x_index][y_index] = logistic_regression.predict(data)[0][0]

positives = (y_train == 1).flatten()
negatives = (y_train == 0).flatten()

plt.scatter(x_train[negatives, 0], x_train[negatives, 1], label='0')
plt.scatter(x_train[positives, 0], x_train[positives, 1], label='1')

# 绘制等高线图
plt.contour(X, Y, Z)

plt.xlabel('param_1')
plt.ylabel('param_2')
plt.title('Microchips Tests')
plt.legend()

plt.show()
1.3 sklearn中的逻辑回归
1.3.1 常用参数详解
class sklearn.linear_model.LogisticRegression(
    penalty='l2', *,
    dual=False,
    tol=0.0001,
    C=1.0,
    fit_intercept=True,
    intercept_scaling=1,
    class_weight=None,
    random_state=None,
    solver='lbfgs',
    max_iter=100,
    multi_class='auto',
    verbose=0,
    warm_start=False,
    n_jobs=None,
    l1_ratio=None
)
常用入参:
-
class_weight:各类别样本的权重。样本需要加权时,使用该参数。 -
fit_intercept:是否需要截距b。一般都需要。 -
max_iter:最大迭代次数,默认100次。在sklearn当中,我们设置参数max_iter最大迭代次数来代替步长,帮助我们控制模型的迭代速度并适时地让模型停下。max_iter越大,代表步长越小,模型迭代时间越长,反之,则代表步长设置很大,模型迭代时间很短。
-
tol:停止标准。如果求解不理想,可尝试设置更小的值。 -
random_state:随机种子。需要每次训练都一样时,就需要设置该参数。
正则化相关:
-
penalty:惩罚项,如果需要正则化,则用。在L1正则化在逐渐加强的过程中,携带信息量小的、对模型贡献不大的特征的参数,会比携带大量信息的、对模型有巨大贡献的特征的参数更快地变成0,所以
L1正则化本质是一个特征选择的过程,掌管了参数的“稀疏性”。L1正则化越强,参数向量中就越多的参数为0,参数就越稀疏,选出来的特征就越少,以此来防止过拟合。因此,如果特征量很大,数据维度很高,我们会倾向于使用L1正则化。由于L1正则化的这个性质,逻辑回归的特征选择可以由Embedded嵌入法来完成。相对的,L2正则化在加强的过程中,会尽量让每个特征对模型都有一些小的贡献,但携带信息少,对模型贡献不大的特征的参数会非常接近于0。
通常来说,如果我们的主要目的只是为了防止过拟合,选择L2正则化就足够了。但是如果选择L2正则化后还是过拟合,模型在未知数据集上的效果表现很差,就可以考虑L1正则化。-
None: 不设置惩罚项 -
'l2': 使用l2正则,默认选项 -
'l1': 使用l1正则 -
'elasticnet': L1和L2惩罚项都用。
-
-
C:正则化强度的倒数,设得越小正则化越强。 -
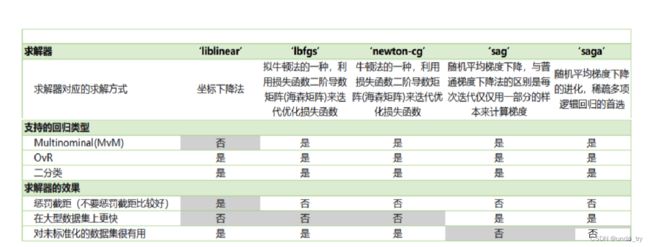
solver:求解器,设置正则化时,需要使用支持正则化的求解器,默认值为lbfgs。
对于小型数据集,'liblinear'是一个很好的选择,而'sag'和'saga'对于大型数据集则更快;
对于多分类问题,只有'newton-cg', 'sag', 'saga'和'lbfgs'能处理多项损失;
'liblinear'仅限于一对多分类(OvR)。
'newton-cholesky'适合样本数远远大于特征数,特别是带有稀有类别的单热编码分类特征。注意,它仅限于二元分类和多分类的一对多分类(OvR)。注意,这个求解器的内存使用依赖于n_features,因为它显式地计算Hessian矩阵。
求解器算法的选择取决于所选择的惩罚项。
- ‘lbfgs’ - [‘l2’, None]
- ‘liblinear’ - [‘l1’, ‘l2’]
- ‘newton-cg’ - [‘l2’, None]
- ‘newton-cholesky’ - [‘l2’, None]
- ‘sag’ - [‘l2’, None]
- ‘saga’ - [‘elasticnet’, ‘l1’, ‘l2’, None]
l1_ratio:Elastic-Net中L1占比。使用Elastic-Net时才需设置。
其它参数:
multi_class: 多分类模式。一般不需修改,用auto就行。
sklearn提供了多种可以使用逻辑回归处理多分类问题的选项。
比如说,我们可以把某种分类类型都看作1,其余的分类类型都为0值,这种方法被称为"一对多"(One-vs-rest),简称OvR,在sklearn中表示为"ovr"。
又或者,我们可以把好几个分类类型划为1,剩下的几个分类类型划为0值,这是一种"多对多"(Many-vs-Many)的方法,简称MvM,在sklearn中表示为"Multinominal"。每种方式都配合L1或L2正则项来使用。

在sklearn中,我们使用参数multi_class来告诉模型,我们的预测标签是什么样的类型。

输入"ovr", "multinomial", "auto"来告知模型,我们要处理的分类问题的类型。默认是"auto"。

'ovr':表示分类问题是二分类,或让模型使用"一对多"的形式来处理多分类问题。
'multinomial':表示处理多分类问题,这种输入在参数solver是'liblinear'时不可用。
'auto':表示会根据数据的分类情况和其他参数来确定模型要处理的分类问题的类型。比如说,如果数据是二分类,或者solver的取值为"liblinear","auto"会默认选择"ovr"。反之,则会选择"multinomial"。
verbose: 输出训练过程。一般不打印,不需修改
warm_start: 是否热启动。一般不需热启动。不需修改。
n_jobs: 使用CPU个数。none一般代表1,-1代表使用所有处理器。
intercept_scaling: 截距特征缩放。一般不需要改。用求解器“liblinear”且要正则化时需要调整。
dual: 是否采用对偶方法。求解器liblinear的专用参数(且penalty=L2),一般不需要改。
1.3.2 详细入参列表
| 参数名称 | 参数输入要求 | 变量说明 | 详细说明 |
|---|---|---|---|
| penalty | l1,l2(默认),elasticnet,none | 惩罚项 | l1/l2即在损失函数中加l1/l2正则项。elasticnet即 l1,l2都加。none为不加。(注意:每个求解器支持的参数不同) |
| dual | True,False(默认) | 是否采用对偶方法 | 求解器liblinear的专用参数(且penalty=L2) |
| tol | 数值,默认le-4 | 停止标准 | 迭代中某些过程小于该数,则停止训练 |
| C | 正数,默认1 | 正则化强度的倒数 | 设得越小正则化越强 |
| fit_intercept | True(默认),False | 是否需要截距b | 如果为False,则b强设为0,模型中wx+b变成wx |
| intercept_scaling | 数值,默认1 | 截距特征缩放 | 求解器用“liblinear”才需要。liblinear会把b也添加到正则项,为避免b的取值受正则化影响过大,正则化取的是b/intercept_scaling,可预设intercept_scaling,调整b受正则化的影响。 |
| class_weight | 字典(多输出为字典列表) ,balanced,None(默认) | 各类别样本的权重 | None:样本权重全为1 字典:{0:1,1:2}代表0类的样本权重为1,1类的样本权重为2.(多输出时,格式为:[{0:1,1:2},{0:1,1:2}]) balanced:把总权重n_samples均分给各类,各类再均分给各个样本。例:有3个类别,10个样本,则每个类别平均权重为10/3,平均到某个类别的权重就为 (10/3)/类别样本数。公式:class_weight = n_samples / (n_classes * np.bincount(y))。 |
| random_state | 整数,随机数实例,None(默认) | 训练过程中的随机种子。 | 如果设定为非None值,则每次训练都会是一样的结果。 |
| solver | newton-cg,lbfgs(默认), liblinear,sag,saga | 求解器,即求解方法 | 求解器支持的惩罚项: newton-cg : [‘l2’, ‘none’] lbfgs:[‘l2’, ‘none’] liblinear: [‘l1’, ‘l2’](仅支持OVR分类) sag: [‘l2’, ‘none’] saga: [‘elasticnet’, ‘l1’, ‘l2’, ‘none’] |
| max_iter | 整数,默认100 | 最大迭代次数 | - |
| multi_class | auto(默认),ovr,multinomial | 多分类模式 | ovr:one-versus-rest,一对剩余。有K类,则训练K个模型,每个模型把第i类当一类,其余当一类。最后选择预测概率最高的一类作为预测类别。 multinomial:多项模式。此时使用逻辑回归的推广模型softmax回归进行多分类。 auto:如果二分类或者求解器为liblinear时,则为OVR,否则为multinomial |
| verbose | 整数,默认0 | 输出训练过程 | 数值越大,越详细。0则为不输出。 |
| warm_start | True/False | 是否热启动 | 为True则沿用之前的解。liblinear不支持。 |
| n_jobs | 整数,默认None | 使用CPU个数 | none一般代表1,-1代表使用所有处理器 |
| l1_ratio | [0,1]的小数,默认None | Elastic-Net中L1占比 | penalty设为Elastic-Net时专用参数,即Elastic-Net中l1的占比 |
1.3.3 方法和属性
方法
clf.predict(X)            :预测X的类别
clf.predict_proba(X)      :预测X属于各类的概率
clf.predict_log_proba(X)  :相当于 np.log(clf.predict_proba())
clf.decision_function(X)  :输出wx+b部分
clf.score(X,y):返回准确率,即模型预测值与y不同的个数占比(支持样本权重:clf.score(X,y,sample_weight=sample_weight))
属性
clf.coef_  :模型系数
clf.intercept_:模型截距
clf.classes_ :类别编号
clf.n_features_in_:特征个数。
clf.feature_names_in_:特征名称。(特征名称为字符串时才会有该属性)
1.4 简单算法案例
1.4.1 利用逻辑回归预测乳腺癌
1、导入相关包
from sklearn.linear_model import LogisticRegression #逻辑回归
from sklearn.datasets import load_breast_cancer  #乳腺癌分类数据集
import numpy as np
import matplotlib.pyplot as plt
from sklearn.model_selection import train_test_split
from sklearn.metrics import accuracy_score#精确性分数
from sklearn.model_selection import cross_val_score   #交叉验证
from sklearn.feature_selection import SelectFromModel #特征选择
%matplotlib inline
2、加载数据集
data = load_breast_cancer()
X = data.data
y = data.target

X.shape
# (569, 30)
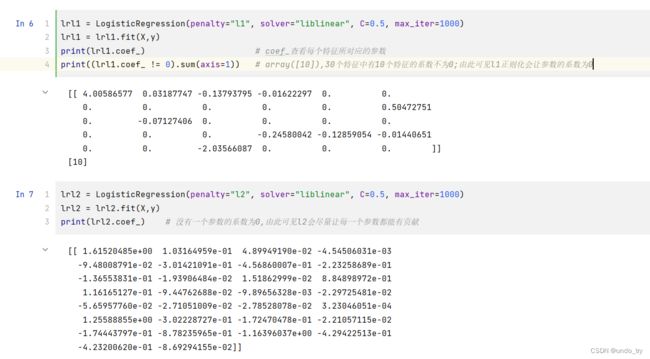
3、利用工具包训练模型,比较l1和l2正则化
lrl1 = LogisticRegression(penalty="l1", solver="liblinear", C=0.5, max_iter=1000)
lrl1 = lrl1.fit(X,y)
print(lrl1.coef_)                      # coef_查看每个特征所对应的参数
print((lrl1.coef_ != 0).sum(axis=1))   # array([10]),30个特征中有10个特征的系数不为0;由此可见l1正则化会让参数的系数为0
lrl2 = LogisticRegression(penalty="l2", solver="liblinear", C=0.5, max_iter=1000)
lrl2 = lrl2.fit(X,y)
print(lrl2.coef_)    # 没有一个参数的系数为0,由此可见l2会尽量让每一个参数都能有贡献
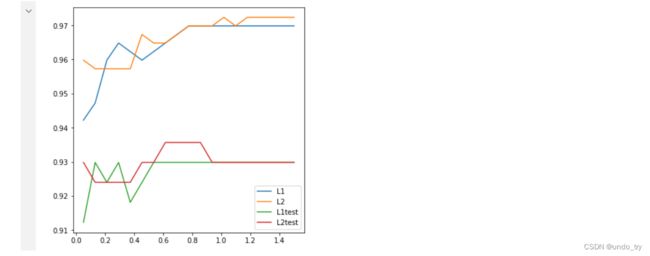
l1 = []
l2 = []
l1test = []
l2test = []
Xtrain, Xtest, Ytrain, Ytest = train_test_split(X, y, test_size=0.3, random_state=420)
for i in np.linspace(0.05, 1.5, 19):
    lrl1 = LogisticRegression(penalty="l1", solver="liblinear", C=i, max_iter=1000)
    lrl1 = lrl1.fit(Xtrain, Ytrain)          #对模型训练
    l1.append(accuracy_score(lrl1.predict(Xtrain), Ytrain))      #训练的结果
    l1test.append(accuracy_score(lrl1.predict(Xtest), Ytest))    #测试的结果

    lrl2 = LogisticRegression(penalty="l2", solver="liblinear", C=i, max_iter=1000)
    lrl2 = lrl2.fit(Xtrain, Ytrain)           #对模型训练
    l2.append(accuracy_score(lrl2.predict(Xtrain), Ytrain))         #训练的结果
    l2test.append(accuracy_score(lrl2.predict(Xtest), Ytest))       #测试的结果

graph = [l1, l2, l1test, l2test]
label = ["L1", "L2", "L1test", "L2test"]

plt.figure(figsize=(6, 6))
for i in range(len(graph)):
    plt.plot(np.linspace(0.05, 1.5, 19), graph[i], label=label[i])   #折线图
plt.legend()
plt.show()
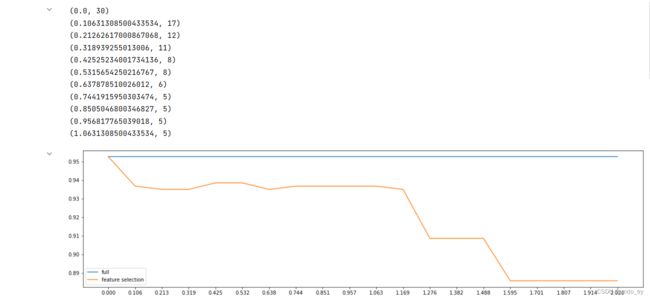
4、逻辑回归中的特征选择
data = load_breast_cancer()
X = data.data
y = data.target

LR_ = LogisticRegression(solver="liblinear", C=0.9, random_state=420)
print(X.shape)
print(cross_val_score(LR_, X, y, cv=10).mean())                      # 0.9508145363408522


X_embedded = SelectFromModel(LR_, norm_order=1).fit_transform(X, y)  # norm_order=1及使用l1范式进行筛选
print(X_embedded.shape)  # (569, 9),可以发现特征数量减少了21个
print(cross_val_score(LR_, X_embedded, data.target, cv=10).mean())   # 0.9368107769423559
fullx = []
fsx = []
threshold = np.linspace(0, abs((LR_.fit(X, y).coef_)).max(), 20)   #coef_查看所有的系数,abs取绝对值
k = 0
for i in threshold:
    X_embedded = SelectFromModel(LR_, threshold=i).fit_transform(X, y)     # 嵌入法特征选择
    fullx.append(cross_val_score(LR_, X, y, cv=5).mean())                  # 完整的特征矩阵的交叉验证结果
    fsx.append(cross_val_score(LR_, X_embedded, y, cv=5).mean())           # 特征选择降维过后的特征矩阵的交叉验证结果
    print((threshold[k], X_embedded.shape[1]))                             # 打印threshold及筛选留下的特征数
    k += 1


plt.figure(figsize=(20, 5))
plt.plot(threshold, fullx, label="full")
plt.plot(threshold, fsx, label="feature selection")
plt.xticks(threshold)
plt.legend()
plt.show()   #可以看到threshold越来越大,留下的特征越来越小,得到的交叉验证分数越来越低
