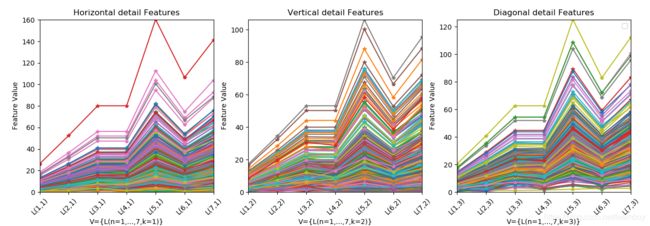
Python使用matplotlib绘制多个子图在一张图上显示的示例, Python how to draw multiple sub-graph in one graph based on matp
本文用matplotlib绘制文本文件数据,文本文件数据格式如下,使用者可以参考,直接拷贝到文本文件中即可,名字可以任意
scratches:scratches_1.jpg:coefs_a_hu7logabslist:7.135543043827731 24.607941829764403 27.88765215617016 27.916812188407885 55.88458464372721 40.802711151392636 56.867428161089826
scratches:scratches_1.jpg:coefs_h_hu7logabslist:1.4824143886563645 6.390153960322266 11.061582113403745 8.364784443002954 18.03464194331083 11.533981471517718 16.833531095343716
scratches:scratches_1.jpg:coefs_v_hu7logabslist:1.4616956420026643 1.754043228165925 5.339530773730381 2.5174696479230048 6.287647995954182 2.924297896456722 5.793906986956152
scratches:scratches_1.jpg:coefs_d_hu7logabslist:2.498364797411506 5.984251253831592 10.830937595747972 7.542595818153806 16.720341445520102 9.444300012770206 14.717336725130815
scratches:scratches_2.jpg:coefs_a_hu7logabslist:7.0838399162104455 22.653707311794825 27.344448739325788 27.080621947581328 54.35501494740578 39.628503416838946 55.36865340469331
scratches:scratches_2.jpg:coefs_h_hu7logabslist:12.972355051230727 25.954699747191768 40.3186144774096 40.309788338441585 80.62398958441233 53.28713820849936 73.15258910627293
scratches:scratches_2.jpg:coefs_v_hu7logabslist:1.3755061874351946 1.3383361627639183 0.04012717315313358 1.1433185793870646 1.5661743402933046 2.1059838562255577 1.1102339889349995
scratches:scratches_2.jpg:coefs_d_hu7logabslist:2.933052272781924 6.020728481157084 12.36672318994465 10.464471088948928 21.612534811993896 12.358838326574807 21.439570055722736
scratches:scratches_3.jpg:coefs_a_hu7logabslist:7.056468664587647 22.462098646654685 27.03171356003439 27.042219792447952 54.107472136050745 39.22340247134851 55.5293890687582
scratches:scratches_3.jpg:coefs_h_hu7logabslist:8.417807547824882 16.916092288959767 26.74726125171905 26.708458481849764 53.43631693559549 35.1664584779117 47.04800719134803
scratches:scratches_3.jpg:coefs_v_hu7logabslist:1.2996200390007315 1.0718728207394994 5.715969218319803 3.547680508604573 5.349294613598237 4.0637767229140636 8.17776181095812
scratches:scratches_3.jpg:coefs_d_hu7logabslist:3.243634478686859 8.158941672448245 13.377630272346073 12.772166991204621 25.770467753883572 16.83751219658844 24.871236108649384
Python代码如下
#File Name: draw_multi_graph.py
#This program is developed by xueshang nai, from IFT Germany. It is open to be cited
# email: [email protected]
# WeChat:leemboy710303
#Cel:+86 15986693076

import argparse
import imutils
import math
import matplotlib.pyplot as plt

import numpy as np
from pylab import *  # 支持中文
def file_txt2curv(text_file):
    file = open(text_file, "r")
    lines = file.readlines()  # 读取全部内容
#scratches: scratches_85.jpg:  coefs_v_hu7logabslist:   4.590776341459459 10.187910209545832 16.637446816496947 15.811731847963783 32.017768776946895 20.900257704334717 30.380069279554096
#0,                 1,               2,                 3 ... 9
    row_h=row_v=row_d=row_a=1
    col=1
    val=0
    names_a = ['L(1,0)', 'L(2,0)', 'L(3,0)', 'L(4,0)', 'L(5,0)', 'L(6,0)', 'L(7,0)']
    names_h = ['L(1,1)', 'L(2,1)', 'L(3,1)', 'L(4,1)', 'L(5,1)', 'L(6,1)', 'L(7,1)']
    names_v = ['L(1,2)', 'L(2,2)', 'L(3,2)', 'L(4,2)', 'L(5,2)', 'L(6,2)', 'L(7,2)']
    names_d = ['L(1,3)', 'L(2,3)', 'L(3,3)', 'L(4,3)', 'L(5,3)', 'L(6,3)', 'L(7,3)']
    plt.figure(1)
    # we will draw 3 sub graph in 1 line
    axh = plt.subplot(1, 3, 1)  #row=1,col=3,axh in col= 1
    axv = plt.subplot(1, 3, 2)  #row=1,col=3,axh in col= 2
    axd = plt.subplot(1, 3, 3)  #row=1,col=3,axh in col= 3
    x = range(len(names_d))
    for line in lines:
        line_array=line.split(':')
        val_str_array=line_array[3].strip().split(' ')
        length=len(val_str_array)
        print ('val_str_array=',val_str_array,'\n')
        if line_array[2]=='coefs_h_hu7loglist':
                print('test')
        elif line_array[2]=='coefs_v_hu7loglist':
                print('test')
        elif line_array[2]=='coefs_d_hu7loglist':
                print('test')
        elif line_array[2]=='coefs_h_hu7logabslist':
            x = np.arange(0, length)
            y1 = [np.float(valstr) for valstr in val_str_array]
            plt.sca(axh)
            plt.plot(x, y1, marker='*')
            plt.xlabel(u"V={L(n=1,...,7,k=1)}")  # X轴标签
            plt.title("Horizontal detail Features")  # 标题
            plt.xticks(x, names_h, rotation=45)
            plt.margins(0)
            plt.subplots_adjust(bottom=0.15)
            plt.ylabel("Feature Value")  # Y轴标签
        elif line_array[2]=='coefs_v_hu7logabslist':
            x = np.arange(0, length)
            y2 = [np.float(valstr) for valstr in val_str_array]
            plt.sca(axv)
            plt.plot(x, y2, marker='*')
            plt.xlabel(u"V={L(n=1,...,7,k=2)}")  # X轴标签
            plt.title("Vertical detail Features")  # 标题
            plt.xticks(x, names_v, rotation=45)
            plt.margins(0)
            plt.subplots_adjust(bottom=0.15)
            plt.ylabel("Feature Value")  # Y轴标签
        elif line_array[2]=='coefs_d_hu7logabslist':
            x = np.arange(0, length)
            y3 = [np.float(valstr) for valstr in val_str_array]
            plt.sca(axd)
            plt.plot(x, y3, marker='*')
            plt.xlabel(u"V={L(n=1,...,7,k=3)}")  # X轴标签
            plt.title("Diagonal detail Features")  # 标题
            plt.xticks(x, names_d, rotation=45)
            plt.margins(0)
            plt.subplots_adjust(bottom=0.15)
            plt.ylabel("Feature Value")  # Y轴标签
        elif line_array[2]=='coefs_a_hu7logabslist':
            print('aproximation is not needed')
    plt.legend()  # 让图例生效
    plt.show()
if __name__ == '__main__':
    ap = argparse.ArgumentParser()
    ap.add_argument("-i", "--txt", required=True,
                    help="path to the input image")
    args = vars(ap.parse_args())
    file_txt2curv(args["txt"])
使用格式,这里你的文本数据文件名为 feature.txt
python draw_multi_graph.py --txt feature.txt
绘制效果如下:
