echarts安装使用_入门
初识 echarts
-
- npm安装
- 常见错误
- 数据加载、更新
- dataset管理数据
npm安装
在vue的项目中使用npm安装
$ npm install echarts --save
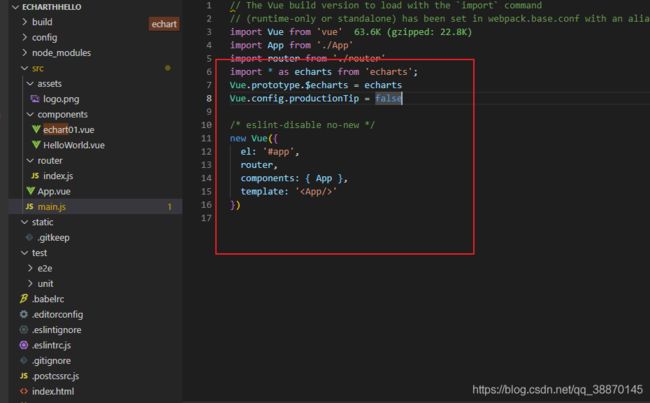
在main.js中导入echarts
import * as echarts from 'echarts';
Vue.prototype.$echarts = echarts
常见错误
Initialize failed: invalid dom
dom没有初始化,echart的实例执行早了,可以先初始化dom然后在函数中调用echart实例。
例:使用echart制作一个柱状图
vue声明方法
methods: {
    echartfunc: function (o) {
      // 基于准备好的dom,初始化echarts实例
      var myChart = echarts.init(document.getElementById("echart2"));
      // 绘制图表
      myChart.setOption({
        title: {
          text: "ECharts 柱状图测试",
        },
        tooltip: {},
        xAxis: {
          data: ["yma16","法外狂徒", "张三", "李四", "maletingda", "echart"],
        },
        yAxis: {},
        series: [
          {
            name: "体重",
            type: "bar",
            data: [45, 50, 48, 43, 60, 65],
          },
        ],
      });
    }
 }
vue的template模板中
<button @click="echartfunc">测试柱状图button>
    <div
    id="echart2" style="width: 1920px; height: 600px; background-color: bisque" >
    div>
效果
数据加载、更新
思考:数据加载通过setOption
更新:使用setTimeOut不断循环调用echart的setOption达到循环渲染的效果。
例:柱状图添加数据
函数声明
export default {
  name: "echart01",
  data() {
    return {
      data:{
          x:["yma16","法外狂徒", "张三", "李四", "maletingda", "echart"],
          y:[45, 50, 48, 43, 60, 65]
      },
      msg: "echart 柱状图测试",
      insert_x:'',//插入横坐标 数据 使用
      insert_y:''
    };
  },
  methods: {
      insert:function(){
          this.data.x.push(this.insert_x);
          this.data.y.push(this.insert_y);
          console.log(this.data)
          setTimeout(this.update,1000);//1s刷新一次
      },
      update:function(){
          setTimeout(this.echartfunc,1000);//1s刷新一次
      },
      echartfunc: function (o) {
      // 基于准备好的dom,初始化echarts实例
      var myChart = echarts.init(document.getElementById("echart2"));
      // 绘制图表
      myChart.setOption({
        title: {
          text: "ECharts 柱状图测试",
        },
        tooltip: {},
        xAxis: {
          data: ["yma16","法外狂徒", "张三", "李四", "maletingda", "echart"],
        },
        yAxis: {},
        series: [
          {
            name: "体重",
            type: "bar",
            data: [45, 50, 48, 43, 60, 65],
          },
        ],
      });
    }
 }
dataset管理数据
dataset支持单独的数据集声明,数据被多个组件复用,利于数据的输入
对比
- 旧版本数据声明,数据分散
option = {
    xAxis: {
        type: 'category',
        data: ['Matcha Latte', 'Milk Tea', 'Cheese Cocoa', 'Walnut Brownie']
    },
    yAxis: {},
    series: [
        {
            type: 'bar',
            name: '2015',
            data: [89.3, 92.1, 94.4, 85.4]
        },
        {
            type: 'bar',
            name: '2016',
            data: [95.8, 89.4, 91.2, 76.9]
        },
        {
            type: 'bar',
            name: '2017',
            data: [97.7, 83.1, 92.5, 78.1]
        }
    ]
}
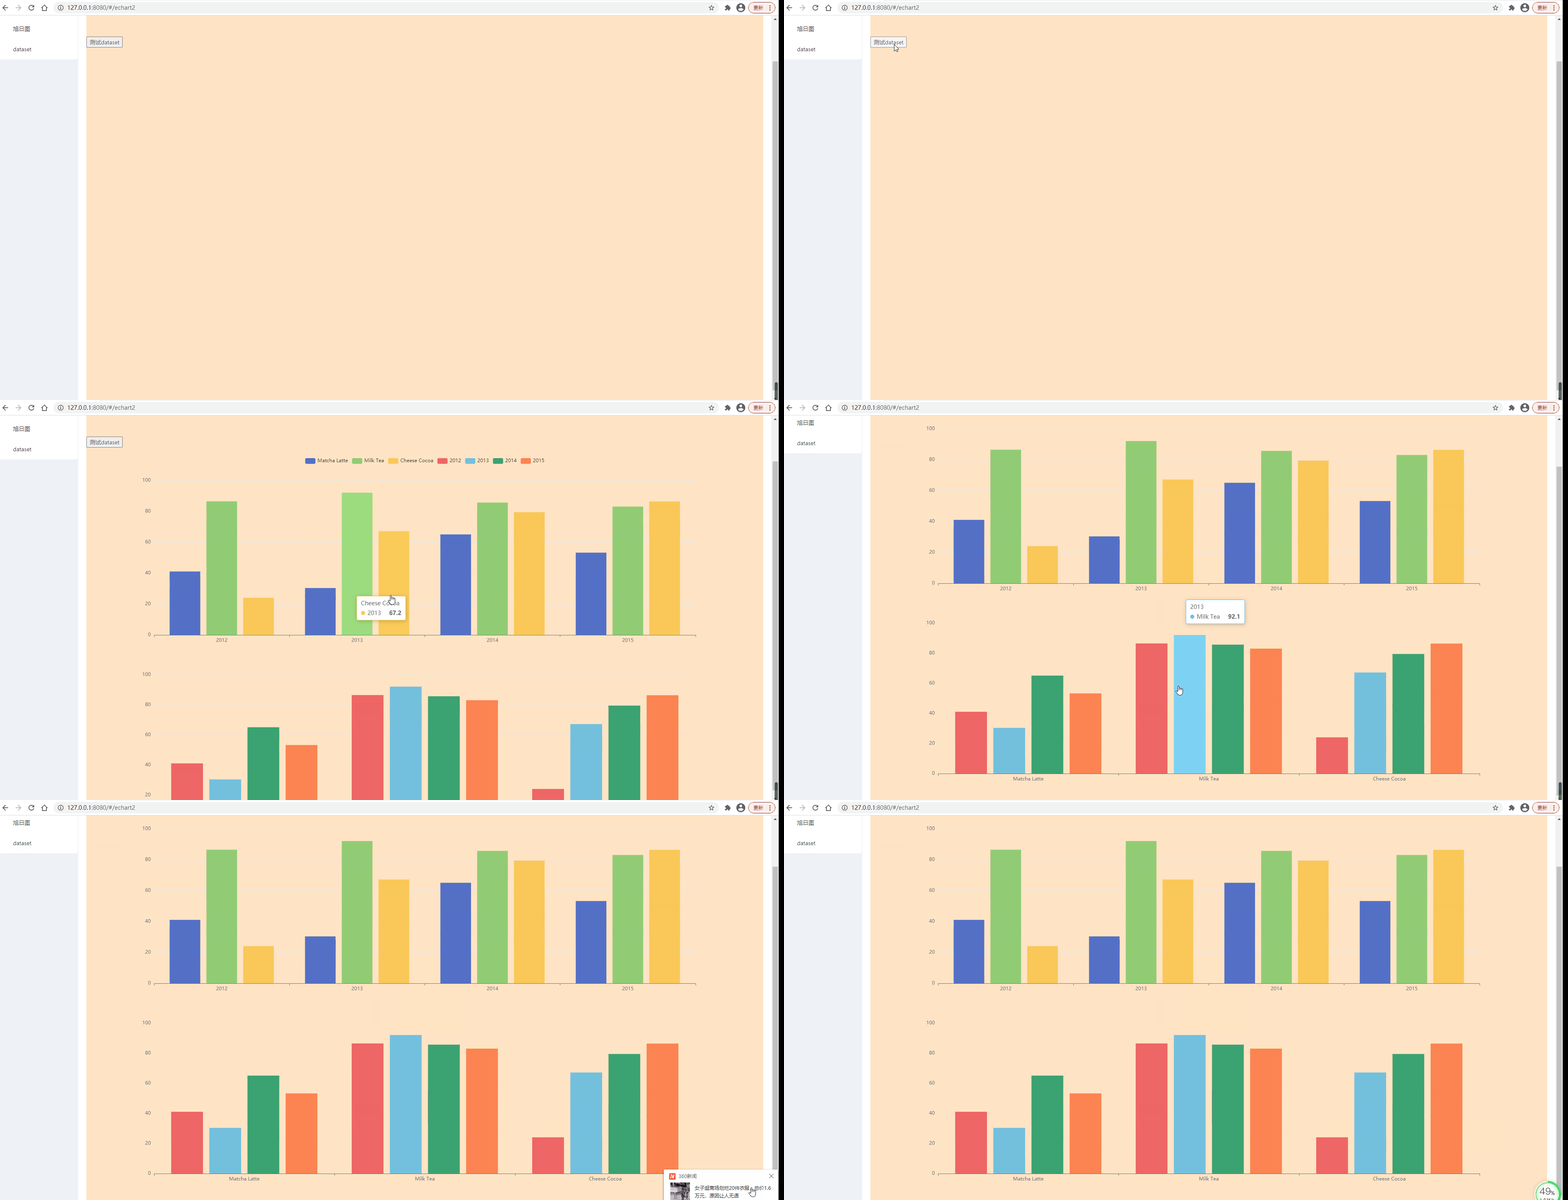
- dataset,数据合并
    var option = {
    legend: {},
    tooltip: {},
    dataset: {
        source: [
            ['product', '2012', '2013', '2014', '2015'],
            ['Matcha Latte', 41.1, 30.4, 65.1, 53.3],
            ['Milk Tea', 86.5, 92.1, 85.7, 83.1],
            ['Cheese Cocoa', 24.1, 67.2, 79.5, 86.4]
        ]
    },
    xAxis: [
        {type: 'category', gridIndex: 0},
        {type: 'category', gridIndex: 1}
    ],
    yAxis: [
        {gridIndex: 0},
        {gridIndex: 1}
    ],
    grid: [
        {bottom: '55%'},
        {top: '55%'}
    ],
    series: [
        // 这几个系列会在第一个直角坐标系中,每个系列对应到 dataset 的每一行。
        {type: 'bar', seriesLayoutBy: 'row'},
        {type: 'bar', seriesLayoutBy: 'row'},
        {type: 'bar', seriesLayoutBy: 'row'},
        // 这几个系列会在第二个直角坐标系中,每个系列对应到 dataset 的每一列。
        {type: 'bar', xAxisIndex: 1, yAxisIndex: 1},
        {type: 'bar', xAxisIndex: 1, yAxisIndex: 1},
        {type: 'bar', xAxisIndex: 1, yAxisIndex: 1},
        {type: 'bar', xAxisIndex: 1, yAxisIndex: 1}
    ]
}
对象数组格式
option = {
    legend: {},
    tooltip: {},
    dataset: {
        // 用 dimensions 指定了维度的顺序。直角坐标系中,
        // 默认把第一个维度映射到 X 轴上,第二个维度映射到 Y 轴上。
        // 如果不指定 dimensions,也可以通过指定 series.encode
        dimensions: ['product', '2015', '2016', '2017'],
        source: [
            {product: 'Matcha Latte', '2015': 43.3, '2016': 85.8, '2017': 93.7},
            {product: 'Milk Tea', '2015': 83.1, '2016': 73.4, '2017': 55.1},
            {product: 'Cheese Cocoa', '2015': 86.4, '2016': 65.2, '2017': 82.5},
            {product: 'Walnut Brownie', '2015': 72.4, '2016': 53.9, '2017': 39.1}
        ]
    },
    xAxis: {type: 'category'},
    yAxis: {},
    series: [
        {type: 'bar'},
        {type: 'bar'},
        {type: 'bar'}
    ]
};


