(P2)PALM软件的基本使用流程
上一篇介绍了PALM在Ubuntu系统上的下载安装及安装后的目录文件结构,这一篇以自带的案例介绍软件的基本操作流程。(请转至example_cbl项目)
输入
声明:官网均有各个变量的说明,以下代码来自软件自带案例
palm的最小输入文件是p3d文件,以下是example_cbl_p3d的详细说明。(文件语言格式Fortran,请自行先学习下语言的基本语法。笔者也是新学者,有非常多的问题,很多参数也不能准确的说出是什么意思,还请不吝赐教,谢谢!!!)
!几点说明
	!1、该运行文件基本由三大块组成:1)initialization_parameters,2)、runtime_parameters,3)调用的模块(自带案例没有调用模块,所以此处并没有涉及,我会在后面自定义项目中介绍)
	!2、一个块由“&”开始,以“/”结束
	!3、!是注释符号
!-------------------------------------------------------------------------------
!-- INITIALIZATION PARAMETER NAMELIST
!   Documentation: https://palm.muk.uni-hannover.de/trac/wiki/doc/app/inipar
!-------------------------------------------------------------------------------
&initialization_parameters
!
!-- grid parameters   !模型大小设置
!-------------------------------------------------------------------------------
    nx                         = 39, ! Number of gridboxes in x-direction (nx+1)
    ny                         = 39, ! Number of gridboxes in y-direction (ny+1)
    nz                         = 40, ! Number of gridboxes in z-direction (nz)     !模型的xyz网格数量,注意x和y需要设置为实际网格数量减去1(说明:网格数设置需要是计算机核心数的倍数)

    dx                         = 50.0, ! Size of single gridbox in x-direction
    dy                         = 50.0, ! Size of single gridbox in y-direction
    dz                         = 50.0, ! Size of single gridbox in z-direction       !各个方向上的分辨率

    dz_stretch_level           = 1225.0, ! Height (in m) where stretching starts
    dz_stretch_factor          = 1.08,   ! dz(k+1) = dz(k) * dz_stretch_factor     !z方向上的网格拉伸
!
!-- initialization     !模型初始化设置
!-------------------------------------------------------------------------------
    initializing_actions       = 'set_constant_profiles', ! initial conditions     !初始化条件,这里使用的是恒定条件

    ug_surface                 = 0.0, ! u-comp of geostrophic wind at surface
    vg_surface                 = 0.0, ! v-comp of geostrophic wind at surface    !地转风的分量(有没有谁能告诉我地转风怎么计算?)

    pt_surface                 = 300.0, ! initial surface potential temp   !初始化的潜在温度

    pt_vertical_gradient       =    0.0,
                                    1.0, ! piecewise temp gradients
    pt_vertical_gradient_level =    0.0,
                                  800.0, ! height level of temp gradients    !温度梯度


!
!-- boundary conditions    !边界条件
!-------------------------------------------------------------------------------
    surface_heatflux           = 0.1, ! sensible heat flux at the bottom surface   !底边的显热通量
    bc_pt_b                    = 'neumann', ! required with surface_heatflux    !
!
!-- numerics
!-------------------------------------------------------------------------------
    fft_method                 = 'temperton-algorithm',   ! build-in fft method

/ ! end of initialization parameter namelist

!-------------------------------------------------------------------------------
!-- RUNTIME PARAMETER NAMELIST
!   Documentation: https://palm.muk.uni-hannover.de/trac/wiki/doc/app/d3par
!-------------------------------------------------------------------------------
&runtime_parameters      !运行时参数
!
!-- run steering
!-------------------------------------------------------------------------------
    end_time                   = 1800.0, ! simulation time of the 3D model    !运行时间

    create_disturbances        = .TRUE., ! randomly perturbate horiz. velocity  !扰乱
    dt_disturb                 = 150.0,  ! interval for random perturbations
    disturbance_energy_limit   = 0.01,   ! upper limit for perturbation energy

    data_output_2d_on_each_pe  = .FALSE., ! don't do 2D output on each MPI rank

!
!-- data output    !数据输出控制
!说明
!数据输出按时间分类:瞬时输出,时间平均输出
!数据输出按纬度分类:3d输出,截面输出,一维序列输出
!-------------------------------------------------------------------------------
    netcdf_data_format         = 2, ! use NetCDF3

    dt_run_control             = 0.0,    ! output interval for run control  !运行控制文件输出间隔
    dt_data_output             = 900.0,  ! output interval for general data  !3d数据输出时间间隔
    dt_data_output_av          = 1800.0, ! output interval for averaged data !时间平均输出数据的输出间隔
    dt_dopr                    = 900.0,  ! output interval for profile data

    data_output                = 'w_xy',
                                 'w_xz',
                                 'w_xz_av',
                                 'theta_xy',
                                 'theta_xz',      !输出的数据,_xy的意思是输出xy截面,_av的意思是输出时间平均数据

    data_output_pr             = 'wtheta', 'w"theta"', 'w*theta*',
                                 'w*2',
                                 '#theta', 'theta*2',

    section_xy                 = 2,
                                 10, ! grid index for 2D XY cross sections      !xy截面输出的高度选择
    section_xz                 = 20, ! grid index for 2D XZ cross sections

    averaging_interval         = 900.0, ! averaging interval general data
    dt_averaging_input         = 10.0,  ! averaging general data sampling rate

    averaging_interval_pr      = 600.0, ! averaging interval profile data
    dt_averaging_input_pr      = 10.0,  ! averaging profile data sampling rate

/ ! end of runtime parameter namelist
运行
该运行文件不用做修改,主要输出的是温度信息。运行的方法如下:
在current_version下打开终端,输入运行命令:palmrun -r example_cbl -c “default” -a “d3#” -X “4”
其中r后是项目名称,c是配置文件,x核心数量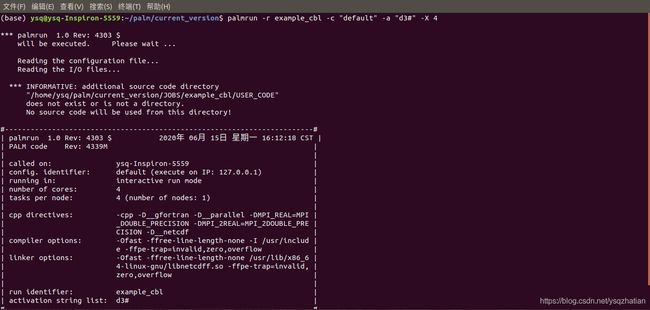
输入y确定,开始运行,输出
输出文件介绍
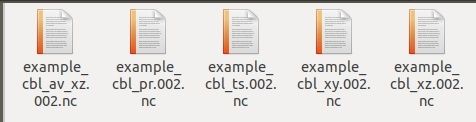
输出文件保存在项目文件夹下的OUTPUT文件夹下,我的结果如下(我的后缀是002,是因为之前我已经运行过两次了):
对应p3d文件的设置会有以上输出,p3d设置参考上述data_output部分
ts文件一直会输出
data_output                = 'w_xy', 'w_xz',  'w_xz_av', 'theta_xy', 'theta_xz',
该设定会输出xy截面文件,xz截面文件,av_xz文件
data_output_pr             = 'wtheta', 'w"theta"', 'w*theta*','w*2', '#theta', 'theta*2',
该设定会输出pr文件
以example_cbl_xy.002.nc为例
1)我们打开它应该会看到两个变量w_xy和theta_xy
2)设定的输出时间间隔是900s,那应该输出900,1800两个时间点的数据
3)设定的输出高度是2和10(此处数字意思是纵向网格的索引,我们设置的网格分辨率是50,所以2代表第二个网格,也就是50-100m,所以其输出的截面是75m处的数据,同理10代表475m处)
用ncview工具快速浏览example_cbl_xy.002.nc,如下(背景是海贼王剧场版打金狮子的那一部黑衣出场的一幕)

至此,基本的使用流程就介绍完毕,之后会介绍如何创建自己的项目,如何引用更多的模块,引入用户自定义的地形地表,建筑物等等