C#曲线绘制1-自定义封装曲线
目录
0、简要说明
1、GraphEdit.cs类封装
2、效果1
(1)创建窗体程序
(2)检测鼠标是否在数据点上
3、效果2
(1)创建窗体程序
4、工程下载连接
0、简要说明
C#绘制曲线自定义类封装
1、封装绘制曲线类。
2、类包括:面板绘制、数据输入、曲线显示。
3、面板大小、字体、曲线颜色和粗细提供属性更改。
4、静态数据曲线和动态数据曲线生成。
1、GraphEdit.cs类封装
public class GraphEdit
{
///
/// 画板宽度
///
public int BoardWidth { get; set; }
///
/// 画板高度
///
public int BoardHeight { get; set; }
///
/// 画板背景颜色
///
public Color BoardColor { get; set; }
///
/// 画图区域颜色
///
public Color AreasColor { get; set; }
///
/// 曲线图颜色
///
public Color GraphColor { get; set; }
///
/// 坐标轴颜色
///
public Color AxisColor { get; set; }
///
/// 刻度线颜色
///
public Color ScaleColor { get; set; }
///
/// 当前绘制的图
///
public Bitmap CurrentImage { get; set; }
///
/// 垂直(纵向)边距(画图区域距离左右两边长度)
///
public int VerticalMargin { get; set; }
///
/// 平行(横向)边距(画图区域距离左右两边长度)
///
public int HorizontalMargin { get; set; }
///
/// X轴刻度线数量
///
public int XScaleCount { get; set; }
///
/// Y轴刻度线数量
///
public int YScaleCount { get; set; }
public GraphEdit(int width, int height, Color boradColor)
{
this.BoardWidth = width;
this.BoardHeight = height;
this.BoardColor = boradColor;
//默认值
this.XScaleCount = 12;
this.YScaleCount = 5;
}
///
/// 获得当前数据画出的曲线面积图
///
/// 需要绘制的数据
/// X轴范围(data数据里面的实际范围)
/// Y轴范围(data数据里面的实际范围)
/// 当前的曲线面积图
public Image GetCurrentGraph(List data, float xRange, float yRange, Point[] pointData)
{
CurrentImage = new Bitmap(BoardWidth, BoardHeight);
Graphics g = Graphics.FromImage(CurrentImage);
g.SmoothingMode = SmoothingMode.AntiAlias; //反锯齿
g.Clear(BoardColor);
//1.确定曲线图区域
int iAreaWidth = BoardWidth - 2 * HorizontalMargin; //画图区域宽度
int iAreaHeight = BoardHeight - 2 * VerticalMargin; //画图区域高度
Point pAreaStart = new Point(HorizontalMargin, VerticalMargin); //画图区域起点
Point pAreaEnd = new Point(BoardWidth - HorizontalMargin, BoardHeight - VerticalMargin); //画图区域终点
Point pOrigin = new Point(HorizontalMargin, BoardHeight - VerticalMargin); //原点
Rectangle rectArea = new Rectangle(pAreaStart, new Size(iAreaWidth, iAreaHeight));
SolidBrush sbAreaBG = new SolidBrush(AreasColor);
g.FillRectangle(sbAreaBG, rectArea);
sbAreaBG.Dispose();
//2.确定坐标轴
Pen penAxis = new Pen(AxisColor, 3);
penAxis.EndCap = LineCap.ArrowAnchor;
g.DrawLine(penAxis, pOrigin, new Point(pAreaStart.X, pAreaStart.Y - VerticalMargin / 2));
g.DrawLine(penAxis, pOrigin, new Point(pAreaEnd.X + HorizontalMargin / 2, pAreaEnd.Y));
penAxis.Dispose();
//3.确定刻度线和标签
Pen penScale = new Pen(ScaleColor, 1);
int fontSize = 8;
for (int i = 0; i <= XScaleCount; i++)
{
int x = i * (iAreaWidth / XScaleCount) + pAreaStart.X;
g.DrawLine(penScale, x, pAreaStart.Y, x, pAreaEnd.Y);
string lbl = (i * (xRange / XScaleCount)).ToString();
if (xRange == 1440) //如果按照一天分钟时间显示
lbl = (i * (xRange / XScaleCount) / 60).ToString();
if (i != 0)
{ g.DrawString(lbl, new Font("微软雅黑", fontSize, FontStyle.Regular), new SolidBrush(AxisColor), new Point(x - fontSize, pAreaEnd.Y + VerticalMargin / 9)); }
}
for (int i = 0; i <= YScaleCount; i++)
{
int y = pAreaEnd.Y - (i * (iAreaHeight / YScaleCount));
g.DrawLine(penScale, pAreaStart.X, y, pAreaEnd.X, y);
string lbl = (i * (yRange / YScaleCount)).ToString();
g.DrawString(lbl, new Font("微软雅黑", fontSize, FontStyle.Regular), new SolidBrush(AxisColor), new Point(pAreaStart.X - (fontSize * lbl.Length) - HorizontalMargin / 9, y - fontSize / 2));
}
//4.画曲线面积
//4.1得到数据
//4.2数据排序 :为了能顺序画出图,需要对X轴上的数据进行排序 冒泡排序
List listPointData = SortingData(data);
//4.3.数据转换:将实际的数据转换到图上的点
List listPointGraphics = new List();//图上的点
foreach (Point point in listPointData)
{
Point p = new Point();
p.X = pAreaStart.X + Convert.ToInt32((iAreaWidth / xRange) * point.X); //120为实际值的取值范围0-120
p.Y = pAreaStart.Y + (iAreaHeight - Convert.ToInt32((iAreaHeight / yRange) * point.Y)); //1000为实际值取值范围0-1000
listPointGraphics.Add(p);
}
Point[] pointCircle = listPointGraphics.ToArray(); //点集合转数组
for (int i = 0; i < listPointGraphics.Count;i++ )
{
//点用圆圈标出
g.FillEllipse(new SolidBrush(GraphColor), pointCircle[i].X - 4, pointCircle[i].Y - 4, 8, 8);
pointData[i].X = pointCircle[i].X;
pointData[i].Y = pointCircle[i].Y;
}
g.DrawCurve(new Pen(GraphColor, 2), listPointGraphics.ToArray());
return CurrentImage;
}
///
/// 数据排序
///
///
/// SortingData(List lp)
{
for (int i = 0; i < lp.Count - 1; i++)
{
for (int j = 0; j < lp.Count - 1 - i; j++)// j开始等于0,
{
if (lp[j].X > lp[j + 1].X)
{
Point temp = lp[j];
lp[j] = lp[j + 1];
lp[j + 1] = temp;
}
}
}
return lp;
} 2、效果1
检测鼠标是否在数据点上
(1)创建窗体程序
加载曲线面板、并创建线程更新面板数据
        private void Form1_Load(object sender, EventArgs e)
        {
            LoadingUI();
        }
        private void LoadingUI()
        {
            graphEdit = new GraphEdit(this.Width, this.Height, boardColor);     //显示面板
            graphEdit.HorizontalMargin = 50;                                   //横水平边距
            graphEdit.VerticalMargin = 80;                                     //竖垂直边距
            graphEdit.AreasColor = Color.FromArgb(100, 0, 0, 0);               //画图区域颜色
            graphEdit.GraphColor = Color.FromArgb(255, 110, 176);              //曲线面积颜色
            graphEdit.AxisColor = Color.FromArgb(255, 255, 255);               //坐标轴颜色
            graphEdit.ScaleColor = Color.FromArgb(20, 255, 255, 255);          //刻度线颜色

            graphEdit.XScaleCount = 24;          //X轴刻度线数量
            graphEdit.YScaleCount = 10;          //Y轴刻度线数量


            toUpdate = new Thread(new ThreadStart(Run));
            toUpdate.Start();
            Thread.Sleep(100);
            timer1.Start();
        }
线程函数运行
        private void Run()
        {
            while (true)
            {
                graphEdit.BoardWidth = this.Width;
                graphEdit.BoardHeight = this.Height;

                if(splineDataflag==0)
                {
                    splineDataflag = 1;
                    listSplineData = this.GetBaseData();
                    pointData = new Point[listSplineData.Count];
                }

                //如果是面积曲线图将最后一个参数设为true
                //Image image = graphEdit.GetCurrentGraph(this.GetBaseData(), XRange, YRange);
                Image image = graphEdit.GetCurrentGraph(listSplineData, XRange, YRange, pointData);
                Graphics g = this.CreateGraphics();  //指定使用那个控件来接受曲线图
                g.DrawImage(image, 0, 0);
                g.Dispose();
                Thread.Sleep(100);                 //每2秒钟刷新一次
            }
        }
添加按钮->曲线数据生成,控制变量splineDataflag
        int splineDataflag = 0;
        private void btnSplineData_Click(object sender, EventArgs e)
        {
            splineDataflag = 0;

        }
生成随机的数据
///
/// 得到(数据库)数据
///
/// GetBaseData()
{
Random r = new Random();
List result = new List(); //数据
for (int i = 0; i < XRange - 200; i += 30)
{
Point p;
if (i < 100)
p = new Point(i, r.Next(20, 200));
else
p = new Point(i, r.Next(20, 220));
result.Add(p);
}
return result;
} (2)检测鼠标是否在数据点上
封装函数
        bool isMouseInEllipse = false;
        private void PointCheck()
        {
            //检测鼠标是否在圆点上
            GraphicsPath vGraphicsPath = new GraphicsPath();
            foreach(Point p in pointData)
            {
                vGraphicsPath.AddEllipse(p.X - 4, p.Y - 4, 8, 8);     // 添加需要检测识别的点
                Region vRegion = new Region(vGraphicsPath);
                isMouseInEllipse = vRegion.IsVisible(mouseP.X, mouseP.Y); // 判断点是否在圆中
                if (isMouseInEllipse)     //检测在点上,鼠标箭头变为手型
                {
                    Cursor.Current = Cursors.SizeNS;//设置鼠标为手指形
                }
            }
            int row = 0;
            int colum = 0;
            if (isLeftButtondowm)
            {

            }
            //Invalidate();   //刷新界面
        }
在定时器函数中调用
        private void timer1_Tick(object sender, EventArgs e)
        {
            PointCheck();
        }
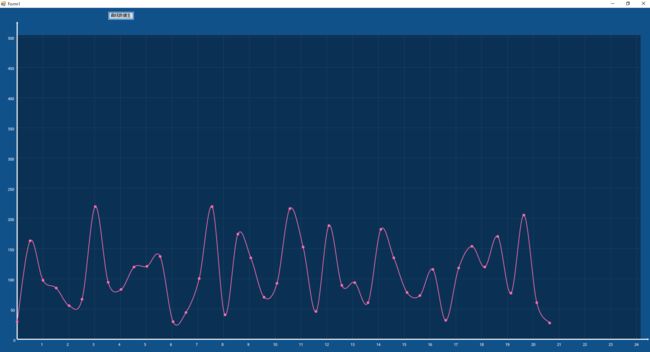
编译运行生成静态数据曲线效果、并检测鼠标在数据原点上是否变化。
3、效果2
(1)创建窗体程序
加载曲线面板、并创建线程更新面板数据
        private void Form1_Load(object sender, EventArgs e)
        {
            LoadingUI();
        }
        private void LoadingUI()
        {
            graphEdit = new GraphEdit(this.Width, this.Height, boardColor);     //显示面板
            graphEdit.HorizontalMargin = 50;                                   //横水平边距
            graphEdit.VerticalMargin = 80;                                     //竖垂直边距
            graphEdit.AreasColor = Color.FromArgb(100, 0, 0, 0);               //画图区域颜色
            graphEdit.GraphColor = Color.FromArgb(255, 110, 176);              //曲线面积颜色
            graphEdit.AxisColor = Color.FromArgb(255, 255, 255);               //坐标轴颜色
            graphEdit.ScaleColor = Color.FromArgb(20, 255, 255, 255);          //刻度线颜色

            graphEdit.XScaleCount = 24;          //X轴刻度线数量
            graphEdit.YScaleCount = 10;          //Y轴刻度线数量
            toUpdate = new Thread(new ThreadStart(Run));
            toUpdate.Start();
        }
线程函数运行
        private void Run()
        {
            while (true)
            {
                Image image = graphEdit.GetCurrentGraph(this.GetBaseData(), XRange, YRange, false);  //如果是面积曲线图将最后一个参数设为true
                Graphics g = this.CreateGraphics();  //指定使用那个控件来接受曲线图

                g.DrawImage(image, 0, 0);
                g.Dispose();
                Thread.Sleep(500);                 //每2秒钟刷新一次
            }
        }
创建随机生成获得的数据列表
///
/// 得到(数据库)数据
///
/// GetBaseData()
{
Random r = new Random();
List result = new List(); //数据
for (int i = 0; i < XRange - 200; i += 30)
{
Point p;
if (i < 100)
p = new Point(i, r.Next(180, 200));
else
p = new Point(i, r.Next(200, 220));
result.Add(p);
}
return result;
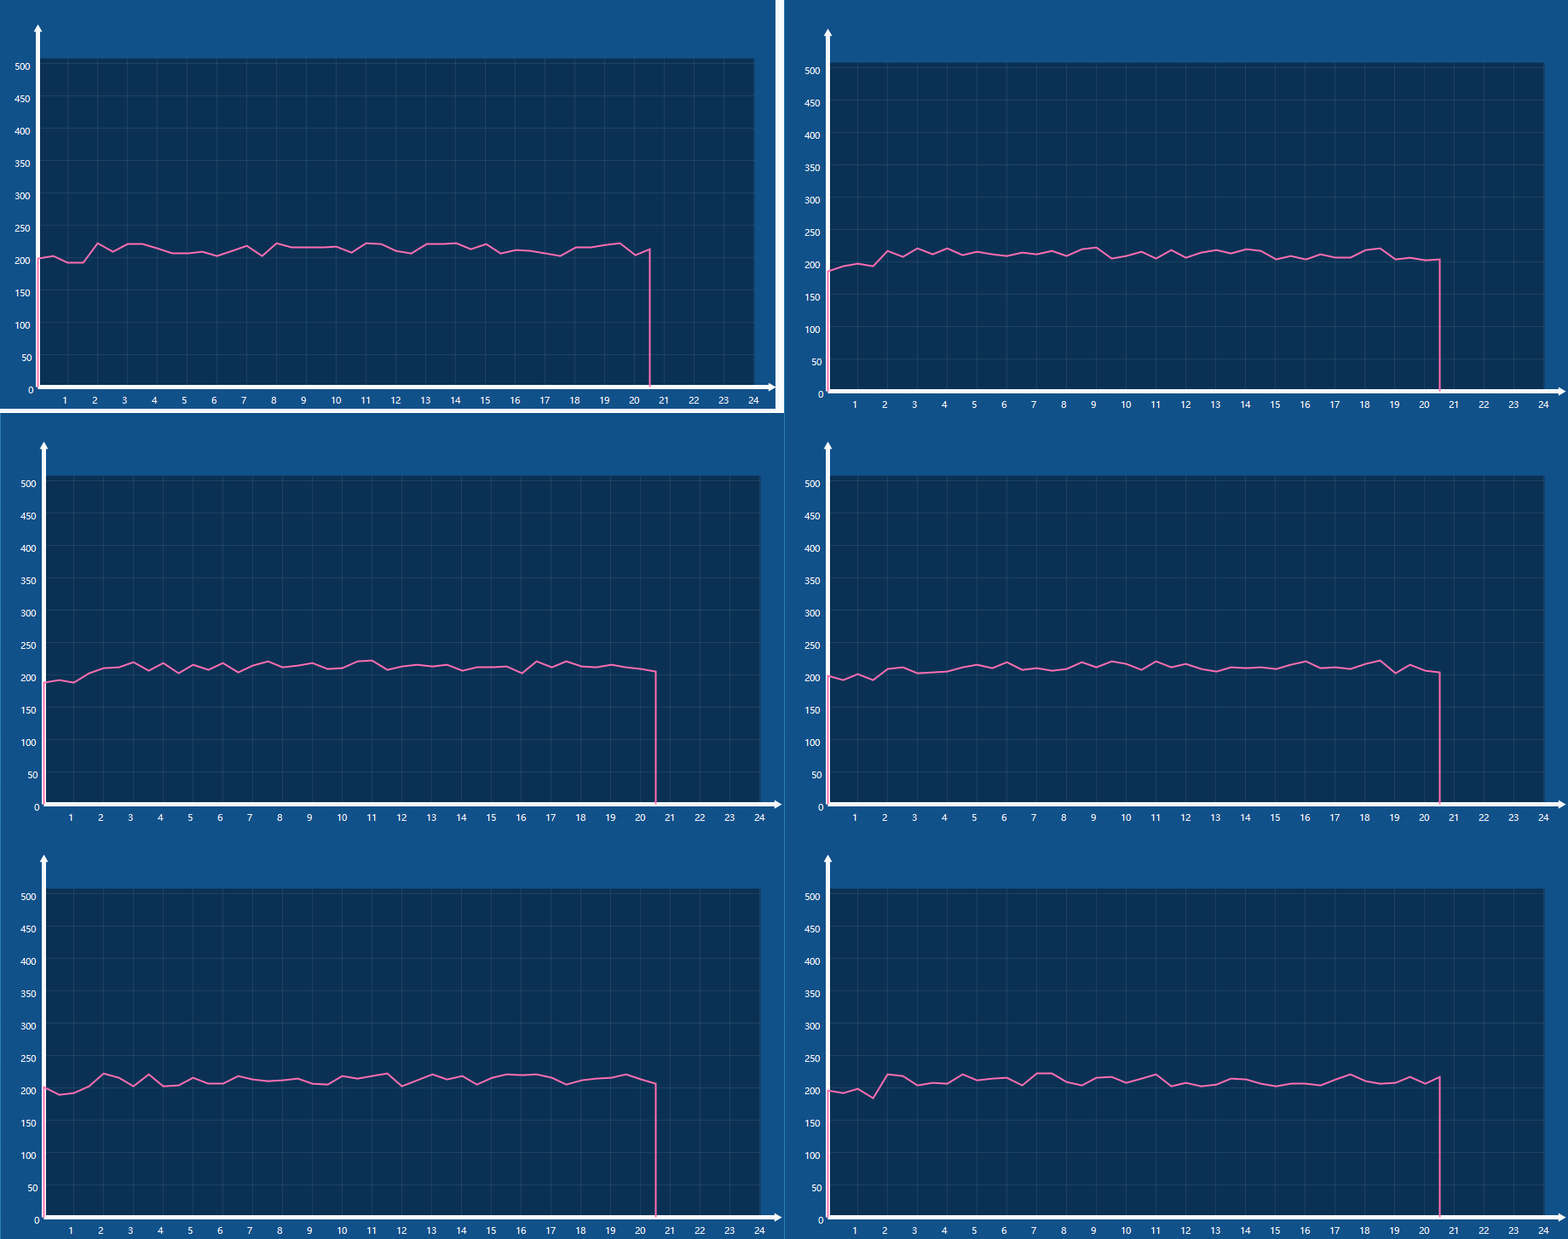
} 编译运行生成动态数据曲线效果。
4、工程下载连接
https://download.csdn.net/download/panjinliang066333/87897486

