<!--
* @Description: file content
* @Version: 2.0
* @Autor: Hu Kang
* @Date: 2023-06-09 17:55:37
* @LastEditors: Hu Kang
* @LastEditTime: 2023-06-12 18:47:39
* @FilePath: \src\views\page\test\index.vue
-->
<template>
<div class="container">
<splashes :chart-data="chartData" />
</div>
</template>
<script setup lang="ts">
import { ref, reactive, watch, watchEffect, computed, getCurrentInstance, nextTick, defineComponent, toRefs } from "vue";
import { onMounted, onBeforeMount, onBeforeUnmount } from 'vue';
import splashes from './components/splashes.vue';
function circle(radius, steps, centerX, centerY) {
var points = [];
for (var i = 0; i < steps; i++) {
var x = centerX + radius * Math.cos(2 * Math.PI * i / steps);
var y = centerY + radius * Math.sin(2 * Math.PI * i / steps);
if (x === 6.5 || x === -6.5) {
y = 0
}
if (y === 6.5 || y === -6.5) {
x = 0
}
points.push([x, y]);
}
return points;
}
var circleArray = circle(6.5, 100, 0, 0);
const chartData = ref({ data: circleArray })
</script>
<style lang="less" scoped>
.container {
width: 600px;
height: 60px;
line-height: 60px;
margin: 0 auto;
text-align: center;
}
</style>
<!--
* @Description: file content
* @Version: 2.0
* @Autor: Hu Kang
* @Date: 2023-05-09 16:34:49
* @LastEditors: Hu Kang
* @LastEditTime: 2023-06-12 17:10:42
* @FilePath: \src\views\page\test\components\splashes.vue
-->
<template>
<div ref="echartsRef" class="content" id="my-div"> </div>
</template>
<script setup lang="ts">
import {
ref,
reactive,
watch,
watchEffect,
computed,
getCurrentInstance,
nextTick,
defineComponent,
toRefs,
onMounted,
} from 'vue';
import * as echarts from 'echarts';
const props = defineProps({
chartData: {
type: Object,
require: true,
default: () => {
return {}
}
},
width: {
type: String,
default: '98%'
},
height: {
type: String,
default: '67vh'
},
autoResize: {
type: Boolean,
default: true
}
})
const { chartData } = toRefs(props)
const echartsData = reactive({
option: {
title: {
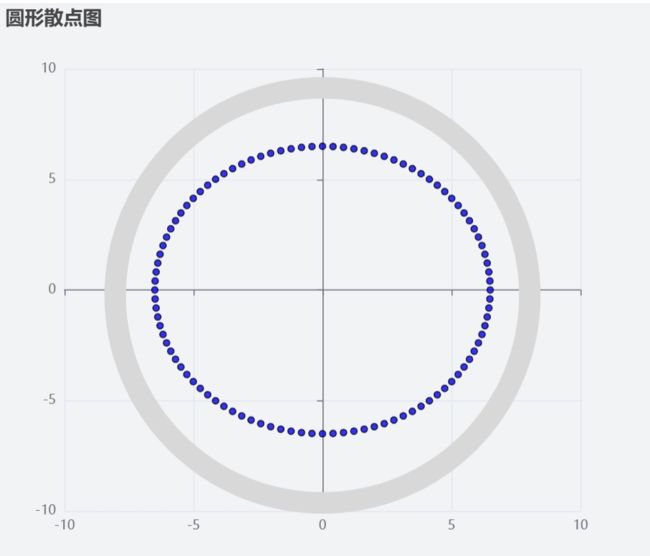
text: "圆形散点图"
},
xAxis: {
min: -10,
max: 10
},
yAxis: {
min: -10,
max: 10
},
tooltip: {
trigger: "item",
formatter: function (params) {
return "x: " + params.data[0] + ", y: " + params.data[1];
}
},
series: [
{
type: "scatter",
data: [],
symbol: "circle",
symbolSize: 6,
itemStyle: {
color: "blue",
opacity: 0.8,
borderColor: "black",
borderWidth: 1
}
},
{
name: "Circle",
type: "gauge",
data: [
{
value: 0,
name: "",
itemStyle: {
color: "#CF4437",
},
},
],
min: 0,
max: 360,
splitNumber: 4,
splitLine: {
show: false,
},
startAngle: 0,
endAngle: 359.9999999,
axisLine: {
lineStyle: {
color: [[100, "#D8D8D8"]],
width: 20,
},
},
pointer: {
show: false,
},
axisTick: {
show: false,
},
axisLabel: {
show: false,
},
detail: {
show: false,
},
},
],
}
})
const { option } = toRefs(echartsData);
const echartsRef = ref<string>();
let echartInstance;
watch(
chartData,
(newValue) => {
if (newValue && newValue.data?.length) {
option.value.series[0].data = newValue.data
}
},
{ deep: true, immediate: true }
)
watch(
option,
(newValue) => {
echartInstance.setOption(newValue);
},
{ deep: true }
)
onMounted(() => {
echartInstance = echarts.init(echartsRef.value, 'macarons');
echartInstance.setOption(option.value);
});
</script>
<style lang="less" scoped>
.content {
width: 100%;
height: 90vh;
}
</style>