吴恩达老师《机器学习》课后习题2之逻辑回归(logistic_regression)
逻辑回归-线性可分
用于解决输出标签y为0或1的二元分类问题。判断邮件是否属于垃圾邮件?银行卡交易是否属于诈骗?肿瘤是否为良性?等等。
案例:根据学生的两门学生成绩,建立一个逻辑回归模型,预测该学生是否会被大学录取
数据集:ex2data1.txt
python实现逻辑回归,
- 目标:建立分类器(求解出三个参数θ0,θ1,θ2)即得出分界线。
备注:θ1对应于exam1,θ2对应于exam2。 - 设定阈值,根据阈值判断录取结果。
备注:阈值指的是最终得到的概率值,将概率值转化成一个类别,一般是>0.5是被录取了,<0.5未被录取。 - 实现内容:
sigmoid:映射到概率的函数
model:返回预测结果值
cost:根据参数计算损失
gradient:计算每个参数的梯度方向
descent:进行参数更新
accuracy:计算精度
代码演示
1.导入所需库
import numpy as np
from matplotlib import pyplot as plt
import pandas as pd
2.读取数据
plt.style.use('fivethirtyeight')  # 样式美化 设置背景样式

data = pd.read_csv('ex2data1.txt', names=['exam1', 'exam2', 'admitted'])
print(data.head(5))  # 查看前五条数据
运行结果:
       exam1      exam2  admitted
0  34.623660  78.024693         0
1  30.286711  43.894998         0
2  35.847409  72.902198         0
3  60.182599  86.308552         1
4  79.032736  75.344376         1
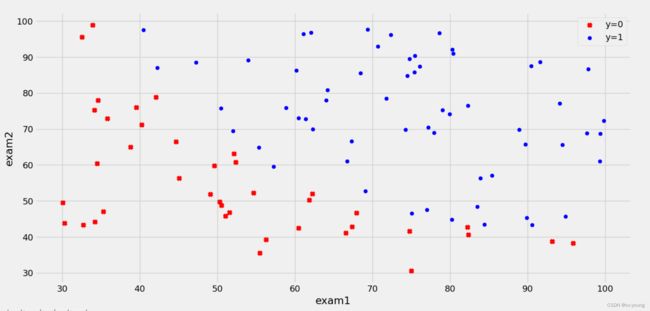
3.数据可视化
flt, ax = plt.subplots()
#绘制散点图。data['admitted'] == 0先获取未被录取的,data[data['admitted'] == 0]['exam1']再取exam1这一列的值作为x,另一列exam2作为y
ax.scatter(data[data['admitted'] == 0]['exam1'], data[data['admitted'] == 0]['exam2'], c='r', marker='x', label='y=0')
ax.scatter(data[data['admitted'] == 1]['exam1'], data[data['admitted'] == 1]['exam2'], c='b', marker='o', label='y=1')
ax.legend()
ax.set(xlabel='exam1',
       ylabel='exam2')
plt.show()
4.构造数据集
def get_Xy(data):
    data.insert(0, 'ones', 1)
    X_ = data.iloc[:, 0:-1]  # 保留了所有行和第0列到最后一列的前一列,包括第0列而不包括最后一列
    X = X_.values  # values方法,该方法将数据框转换为一个二维numpy数组 可以对二维数组进行更复杂的操作,例如矩阵乘法、转置、求逆矩阵等操作

    y_ = data.iloc[:, -1]  # 使用了"-1"作为列参数的值,表示选取最后一列的所有行数据。
    y = y_.values.reshape(len(y_), 1)
    return X, y


X, y = get_Xy(data)
print(X.shape)
print(y.shape)
运行结果:
(100, 3)
(100, 1)
5.损失函数
# sigmoid函数 常用的一个逻辑函数,为S形函数
def sigmoid(z):
    return 1 / (1 + np.exp(-z))


# 损失函数
# X输入特征
# y标签
# theta参数或权重
def costFunction(X, y, theta):
    A = sigmoid(X @ theta)
    first = y * np.log(A)
    second = (1 - y) * np.log(1 - A)
    return -np.sum(first + second) / len(X)


theta = np.zeros((3, 1))
print(theta.shape)

# 查看初始损失函数
cost_init = costFunction(X, y, theta)
print(cost_init)
运行结果:
(3, 1)
0.6931471805599453
6.梯度下降函数
# 梯度下降函数
def gradientDescent(X, y, theta, iters, alpha):
    m = len(X)
    costs = []

    for i in range(iters):
        A = sigmoid(X @ theta)
        theta = theta - (alpha / m) * X.T @ (A - y)
        cost = costFunction(X, y, theta)
        costs.append(cost)
        if i % 10000 == 0:
            print(cost)
    return costs, theta


alpha = 0.004
iters = 200000
costs, theta_final = gradientDescent(X, y, theta, iters, alpha)
print('--------')
print(theta_final)
运行结果:
1.9886538578930086
2.7066763807478127
5.159653459570274
1.3288041261254455
1.6525865746034045
0.36435481826406835
0.4570874651331585
1.967668156490788
1.9529869630682553
1.5657887557853332
1.1016560492529435
0.9496771922978091
0.8120065185985733
0.6920502091863593
0.589394687724505
0.5020499317654381
0.42847067824051116
0.3679885174844045
0.3202671536208952
0.2844022779880832
--------
[[-23.77376631]
 [  0.18688441]
 [  0.18043173]]
7.用训练集预测和验证
# 返回的是list
def predict(X, theta):
    prob = sigmoid(X @ theta)
    return [1 if x > 0.5 else 0 for x in prob]


y_ = np.array(predict(X, theta_final))
print(type(y_))
print(type(predict(X, theta_final)))
print(y_.shape)
# y_pre是一个一维numpy数组,表示模型的预测结果
y_pre = y_.reshape(len(y_), 1)
# y是一个一维numpy数组,表示样本的真实标签。
acc = np.mean(y_pre == y)  # 使用numpy库中的.mean方法来计算模型预测结果的准确率。
print(acc)# 查看准确率。
运行结果:
<class 'numpy.ndarray'>
<class 'list'>
(100,)
0.86
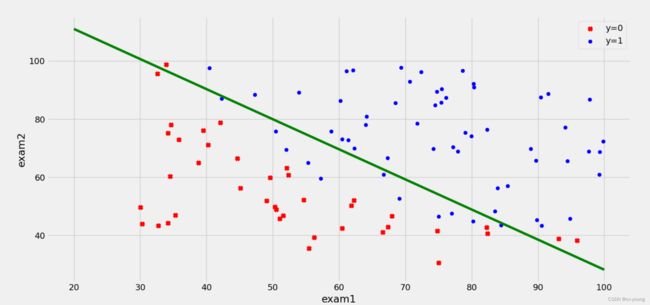
9.决策边界
coef1 = -theta_final[0, 0] / theta_final[2, 0]
coef2 = -theta_final[1, 0] / theta_final[2, 0]
x = np.linspace(20, 100, 100)  # 使用numpy库中的linspace方法,生成一个等差数列。
f = coef1 + coef2 * x

ax.plot(x, f, c='g')
plt.show()
逻辑回归-线性不可分
数据不可分案例:
假设你是工厂的生产主管,你要决定是否芯片要被接受或者抛弃。
数据集 ex2data2.txt,芯片在两次测试中的测试结果
1.导入所需库
import numpy as np
from matplotlib import pyplot as plt
import pandas as pd
2.读取数据
# 读取数据
data = pd.read_csv('ex2data2.txt', names=['Test1', 'Test2', 'Accepted'])
print(data.head())
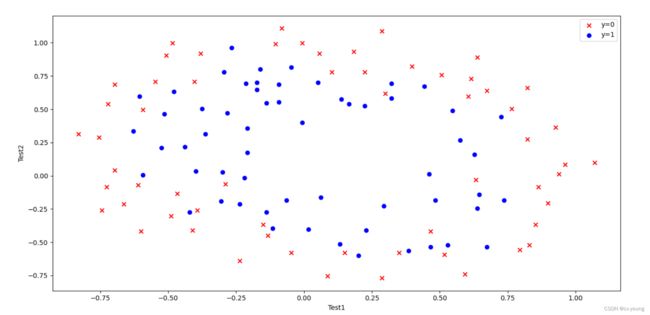
3.数据可视化
fig, ax = plt.subplots()
ax.scatter(data[data['Accepted'] == 0]['Test1'], data[data['Accepted'] == 0]['Test2'], c='r', marker='x', label='y=0')
ax.scatter(data[data['Accepted'] == 1]['Test1'], data[data['Accepted'] == 1]['Test2'], c='b', marker='o', label='y=1')
ax.legend()
ax.set(xlabel='Test1',ylabel='Test2')
plt.show()
4.特征映射
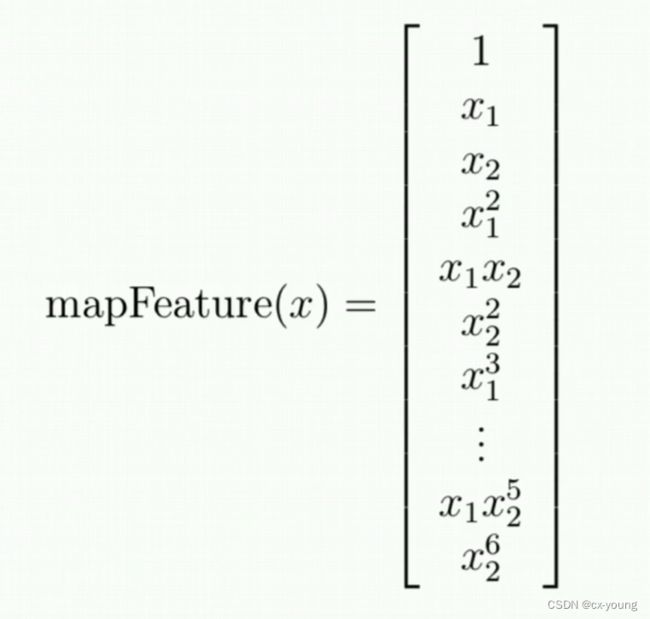
在机器学习中,特征映射(Feature Mapping)是指通过一个映射函数将原始的数据集映射到一个新的特征空间中。这个映射函数通常是非线性的,目的是将原始数据转换为更容易被分类器理解和处理的形式,以提高分类器的性能。

举例阶次低一些的,比如x1和x2二次
则通过特征映射
1, x1, x2, x1^2, x2^2, x1x2
一共6项
# 特征映射
# x1,x2是特征,power是阶次
def feature_mapping(x1, x2, power):
    data = {}
    for i in np.arange(power + 1):
        for j in np.arange(i + 1):
            data['F{}{}'.format(i - j, j)] = np.power(x1, i - j) * np.power(x2, j)
    return pd.DataFrame(data)


x1 = data['Test1']
x2 = data['Test2']
data2 = feature_mapping(x1,x2,6)
print(data2.head())
运行结果:
 F00       F10      F01       F20  ...       F33       F24       F15       F06
0  1.0  0.051267  0.69956  0.002628  ...  0.000046  0.000629  0.008589  0.117206
1  1.0 -0.092742  0.68494  0.008601  ... -0.000256  0.001893 -0.013981  0.103256
2  1.0 -0.213710  0.69225  0.045672  ... -0.003238  0.010488 -0.033973  0.110047
3  1.0 -0.375000  0.50219  0.140625  ... -0.006679  0.008944 -0.011978  0.016040
4  1.0 -0.513250  0.46564  0.263426  ... -0.013650  0.012384 -0.011235  0.010193

[5 rows x 28 columns]
5.构造数据集
# 构造数据集 data2由x1和x2组成的一系列特征
X = data2.values
print(X.shape)
y = data.iloc[:, -1].values
y = y.reshape(len(y), 1)
print(y.shape)
运行结果:
(118, 28)
(118, 1)
6.损失函数
def sigmoid(z):
    return 1 / (1 + np.exp(-z))


def costFunction(X, y, theta, lamda):
    A = sigmoid(X @ theta)
    first = y * np.log(A)
    second = (1 - y) * np.log(1 - A)
    reg = np.sum(np.power(theta[1:], 2)) * (lamda / (2 * len(X)))
    return -np.sum(first + second) / len(X) + reg


theta = np.zeros((28, 1))
lamda = 1
cost_init = costFunction(X, y, theta, lamda)
print(cost_init)
运行结果:
0.6931471805599454
7.梯度下降函数
def gradientDesent(X, y, theta, alpha, iters, lamda):
    costs = []
    for i in range(iters):
        reg = theta[1:] * (lamda / len(X))
        reg = np.insert(reg, 0, values=0, axis=0)
        A = sigmoid(X @ theta)
        theta = theta - (X.T @ (A - y)) * alpha / len(X) - reg
        cost = costFunction(X, y, theta, lamda)
        costs.append(cost)
        if i % 1000 == 0:
            print(cost)
    return theta, costs


alpha = 0.001
iters = 200000
lamda = 0.001
theta_final, costs = gradientDesent(X, y, theta, alpha, iters, lamda)
部分运行结果:
......
0.4696661127515702
0.4695667254210448
0.4694688006729474
0.4693723153356451
0.4692772466441765
8.准确率
# 准确率
# 返回的是list
def predict(X, theta):
    prob = sigmoid(X @ theta)
    return [1 if x > 0.5 else 0 for x in prob]


y_ = np.array(predict(X, theta_final))
y_pre = y_.reshape(len(y_), 1)
# y_pre是一个一维numpy数组,表示模型的预测结果
# y是一个一维numpy数组,表示样本的真实标签。
acc = np.mean(y_pre == y)  # 使用numpy库中的.mean方法来计算模型预测结果的准确率。
print(acc)  # 查看准确率
运行结果:
0.8305084745762712
9.决策界面
# 决策界面
x = np.linspace(-1.2, 1.2, 200)  # 该函数用于生成一个包含200个等间隔数字的一维numpy数组,从-1.2开始,到1.2结束(包含1.2),步长为(1.2-(-1.2))/(200-1)≈0.0121。
xx, yy = np.meshgrid(x, x)  # 生成一个多维网格矩阵 此处是二维坐标矩阵
z = feature_mapping(xx.ravel(), yy.ravel(), 6).values  # ravel()将多维数组降为一维数组,展开的顺序是,先按照行的顺序排列元素,再按照列的顺序排列。
zz = z @ theta_final
zz = zz.reshape(xx.shape)  # 使用 reshape() 函数将其重新变为二维形式,恢复了原来的形状。
'''
contour() 函数的参数有:

x 和 y:绘制等高线的二维坐标系的横、纵坐标值,通常使用 np.meshgrid() 生成;
z:绘制等高线的二元函数值。是根据某个二元函数计算得到的在这些点上的函数值
level:指定绘制哪些值的等高线。取值可以是标量,表示要绘制该值的等高线;也可以是一维数组,表示要绘制这些值对应的等高线。
'''
plt.contour(xx, yy, zz, 0)  # 绘制等高线图
plt.show()
学习视频:
https://www.bilibili.com/video/BV1Xt411s7KY?p=1&vd_source=b3d1b016bccb61f5e11858b0407cc54e
https://www.bilibili.com/video/BV124411A75S/?spm_id_from=333.1007.top_right_bar_window_history.content.click&vd_source=b3d1b016bccb61f5e11858b0407cc54e


