DNA 7. 基因组拷贝数变异分析及可视化 (GISTIC2.0)
桓峰基因
生物信息分析,SCI文章撰写及生物信息基础知识学习:R语言学习,perl基础编程,linux系统命令,Python遇见更好的你
119篇原创内容
公众号
桓峰基因公众号推出基于基因组变异数据生信分析教程并配有视频在线教程,目前整理出来的教程目录如下:
DNA 1. Germline Mutation Vs. Somatic Mutation 傻傻分不清楚
DNA 2. SCI 文章中基因组变异分析神器之 maftools
DNA 3. SCI 文章中基因组变异分析神器之 maftools
DNA 4. SCI 文章中基因组的突变信号(maftools)
DNA 5. 基因组变异文件VCF格式详解
DNA 6. 基因组变异之绘制精美瀑布图(ComplexHeatmap)
DNA 7. 基因组拷贝数变异分析及可视化 (GISTIC2.0)
今天介绍一款,做完CNV calling的分析,一般来说就是圈图,曼哈顿图,这个我都有介绍过,但是技术的进步,有生产更有意义的工具,可以更加精准的定位热点区域以及热点基因,今天就先介绍一款非常好用的软件 GISTIC2.0
前 言
癌症是通过逐步获得体细胞遗传改变形成的,包括点突变、拷贝数改变和融合事件,这些改变影响调控细胞生长和生存的关键基因的功能。这些改变靶向的致癌基因和肿瘤抑制基因的识别大大加快了对癌症发病机制的理解和新的治疗弱点的识别。特别是体细胞拷贝数改变(SCNAs)靶向的基因,在肿瘤发生和癌症治疗中发挥着重要作用。阵列和测序平台的显著改进使数以千计的癌症基因组中SCNAs的高分辨率表征成为可能。而探索驱动型SCNAs及对应受影响的基因,存在两个挑战:
1. 在每个细胞分裂过程中都会随机获得体细胞变异,其中只有一些(驱动变异, ‘driver’ alterations)会促进癌症的发展;2. SCNAs可能同时影响多达数千个基因,但驱动变异的选择性优势可能仅由这些基因中的一个或少数几个介导;
2. 识别drivers的一种常见方法是研究大量的癌症样本,其概念是,包含driver events的区域应该比只包含passengers的区域变异得更频繁。
GISTIC(Genomic Identification of Significant Targets in Cancer)算法的提出即是基于此。算法文章于2011年发表在Genome Biology上,至今引用量已过一千。
我们看下该软件分析流程的pipeline:
软件下载及安装
下载及安装包括两部分,一部分是需要先安装matlab,如果您的已经配置完成,那请忽略;一部分是GISTIC2.0安装。
1. 安装matlab
matlab下载官网链接:
https://ssd.mathworks.cn/supportfiles/downloads/R2014b/deployment_files/R2014b/installers/glnxa64/MCR_R2014b_glnxa64_installer.zip
嫌麻烦,可以关注桓峰基因公众号,发送消息 matlab 即可下载,如下:
解压安装:
unzip -d MatlabMCR MCR_R2014b_glnxa64_installer.zip
cd MatlabMCR
ls
./install -mode silent -agreeToLicense yes -destinationFolder ~/software/MatlabMCR/MATLAB_Compiler_Runtime/
#注意,最后选项填入的路径需要是绝对路径
安装成功标记,如下:
(Jun 11, 2022 18:35:32) Exiting with status 0
(Jun 11, 2022 18:35:32) End - Successful.
添加环境变量:
export mcr_root=/home/software/MatlabMCR/MATLAB_Compiler_Runtime
export LD_LIBRARY_PATH=$mcr_root/v84/runtime/glnxa64:$mcr_root/v84/bin/glnxa64:$mcr_root/v84/sys/os/glnxa64:
export XAPPLRESDIR=$mcr_root/v84/X11/app-defaults
2. 安装GISTIC2.0
官网下载链接:
ftp://ftp.broadinstitute.org/pub/GISTIC2.0/
利用wget 下载更方便,加参数 -c 防止断掉,可以续传,这个非常重要。
wget -c ftp://ftp.broadinstitute.org/pub/GISTIC2.0/GISTIC_2_0_23.tar.gz
也可到关注桓峰基因公众号,发消息 GISTIC2.0 即可下载,方法同上。
下载完成之后解压:
mkdir GISTIC2
mv GISTIC_2_0_23.tar.gz GISTIC2/ && cd GISTIC2/
tar zxf GISTIC_2_0_23.tar.gz
此时目录下有这些文件
examplefiles/
example_results/
gistic2*
GISTIC_2_0_23.tar.gz
GISTICDocumentation_standalone_files/
GISTICDocumentation_standalone.htm*
gp_gistic2_from_seg*
INSTALL.txt*
LICENSE.txt*
MATLAB_Compiler_Runtime/
MCR_Installer/
README.txt*
refgenefiles/
run_gistic_example*
source/
但是呢,这个GISTIC2.0将matlab封装在自己的软件包里面,估计是觉得每次都有人问题matlab该下载哪个版面,毕竟matlab更新有些快,实在跟不上脚步,进行安装:
mkdir MATLAB_Compiler_Runtime
cd MCR_Installer/
unzip MCRInstaller.zip
./install -mode silent -agreeToLicense yes -destinationFolder ~/biosoft/GISTIC2/MATLAB_Compiler_Runtime/
如果出现类似的错误:
java.lang.InternalError: Can't connect to X11 window server using ':0' as the value of the DISPLAY variable.
直接取消显示:
$ unset DISPLAY
成功没有报错就是成功了,最后软件有一些提示:
所以接下来我们按照要求设置matlab的环境变量:
export XAPPLRESDIR=/home/data/t030339/software/GISTIC2/MATLAB_Compiler_Runtime/v83/X11/app-defaults:$XAPPLRESDIR
export LD_LIBRARY_PATH=/home/data/t030339/software/GISTIC2/MATLAB_Compiler_Runtime/v83/runtime/glnxa64:/home/data/t030339/software/GISTIC2/MATLAB_Compiler_Runtime/v83/bin/glnxa64:/home/data/t030339/software/GISTIC2/MATLAB_Compiler_Runtime/v83/sys/os/glnxa64:$LD_LIBRARY_PATH
实例操作
1. 数据读取
我们看下输入文件格式,在例子文件中:
$ cd examplefiles
arraylistfile.txt*
cnvfile.txt*
markersfile.txt*
segmentationfile.txt*

$ cd refgenefiles
hg16.mat*
hg17.mat*
hg18.mat*
hg19.mat*
hg19.UCSC.add_miR.140312.refgene.mat*
hg38.UCSC.add_miR.160920.refgene.mat*
再看看每个文件的格式:
a. segmentationfile.txt
$ less  ./examplefiles/segmentationfile.txt
secondary_GBM_6 1       328296  79786669        2632    -0.5836395
secondary_GBM_6 1       79787684        79787955        2       -3.057187
secondary_GBM_6 1       79791835        141706009       2075    -0.582535
secondary_GBM_6 1       142661411       245729550       4494    0.1422075
secondary_GBM_6 2       53452   44596407        1950    0.126455
b. markersfile.txt
$ le ./examplefiles/markersfile.txt
SNP_A-1738457   1       328296
SNP_A-1658232   1       1435232
SNP_A-1718890   1       2103664
SNP_A-1678466   1       2708522
SNP_A-1676440   1       2719853
c. hg16.mat
属于二进制文件,看不了哈,直接在软件调取就可以使用了,注意自己参考基因组的版本号即可!
d. arraylistfile.txt
$ le ./examplefiles/arraylistfile.txt
array
primary_GBM_2
primary_GBM_4
secondary_GBM_1
primary_GBM_6
primary_GBM_7
e. cnvfile.txt
$ le ./examplefiles/cnvfile.txt
SNP_A-1511055   Variation_4091
SNP_A-1641749   Variation_2158
SNP_A-1641750   Variation_2503
SNP_A-1641752   Variation_3868
SNP_A-1641771   Variation_3746
2. 实际操作
软件包里面自带的例子非常方便使用:
./run_gistic_example
但是实际操作中就没那么简单,我们可以看下例子具体代码:
#!/bin/sh
## run example GISTIC analysis

## output directory
echo --- creating output directory ---
basedir=`pwd`/example_results
mkdir -p $basedir

echo --- running GISTIC ---
## input file definitions
segfile=`pwd`/examplefiles/segmentationfile.txt
markersfile=`pwd`/examplefiles/markersfile.txt
refgenefile=`pwd`/refgenefiles/hg16.mat
alf=`pwd`/examplefiles/arraylistfile.txt
cnvfile=`pwd`/examplefiles/cnvfile.txt
## call script that sets MCR environment and calls GISTIC executable
./gistic2 -b $basedir -seg $segfile -mk $markersfile -refgene $refgenefile -alf $alf -cnv $cnvfile -genegistic 1 -smallmem 1 -broad 1 -brlen 0.5 -conf 0.90 -armpeel 1 -savegene 1 -gcm extreme
所以说,我们在准备数据的时候一定要看下这个例子具体代码,然后修改自己的shell。关于参数的使用有机会再跟大家一一介绍,没有太大问题就默认参数先分析这即可!
结果解析
生成了28个结果文件,下面重要的文件都已经加一定的注释,方便大家理解,如下:
$ cd example_results/
$ ll
all_data_by_genes.txt #基因在不同样本中具体的拷贝数数值
all_lesions.conf_90.txt #识别到的拷贝数扩增和缺失的Peak区域
all_thresholded.by_genes.txt #基因在不同样本中拷贝数数值离散化后的结果,-2代表缺失两个拷贝,-1代表缺失一个拷贝,0代表拷贝数正常,1代表增加一个拷贝,2代表扩增两个拷贝
amp_genes.conf_90.txt #识别到的拷贝数扩增的Peak区域及区域内涉及到的基因
amp_qplot.pdf
amp_qplot.png
arraylistfile.txt
broad_data_by_genes.txt #基因在不同样本中具体的拷贝数数值(只考虑 arm events)
broad_significance_results.txt #显著发生拷贝数变异的broad区域
broad_values_by_arm.txt #染色体臂在样本中的拷贝数数值
D.cap1.5.mat
del_genes.conf_90.txt #识别到的拷贝数缺失的Peak区域及区域内涉及到的基因
del_qplot.pdf
del_qplot.png
focal_dat.0.5.mat
focal_data_by_genes.txt #基因在不同样本中具体的拷贝数数值(只考虑 focal events)
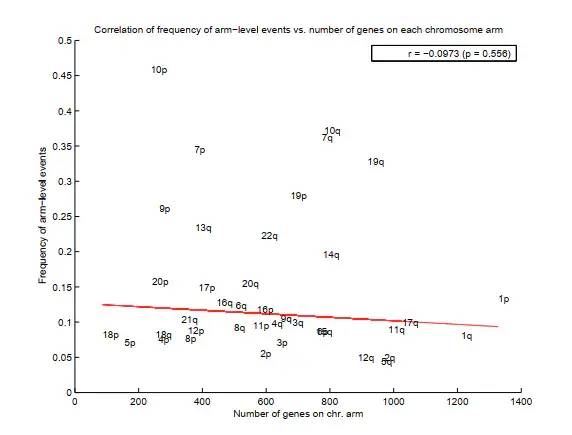
freqarms_vs_ngenes.pdf
gistic_inputs.mat
peak_regs.mat
perm_ads.mat
raw_copy_number.pdf
raw_copy_number.png
regions_track.conf_90.bed
sample_cutoffs.txt
sample_seg_counts.txt
scores.0.5.mat
scores.gistic #该算法的打分结果,可导入IGV进行可视化
wide_peak_regs.mat
结果展示
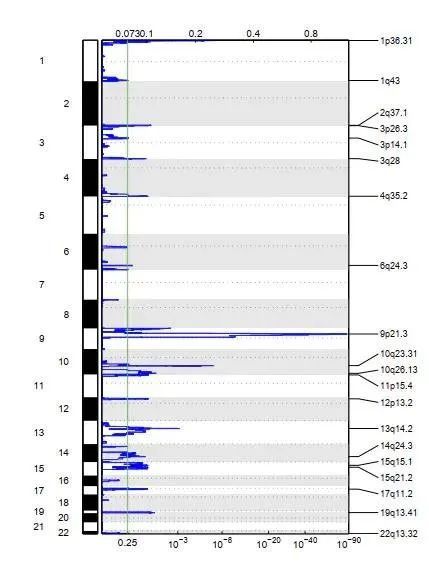
生成文件中有一些输出的图像,我们看看都是什么意思?
1. 基因与arm-level相关性
2. Manhattan plot:
3. Deletion GISTIC plot:
上面是G-scores ,下面是q-values ,显示每条染色体显著删除的位置。在“绿色”垂线右边的是有统计学意义的。
4. Amplification GISTIC plot:
GISTIC2.0在线分析
另外,Broad institute 开发的GenePattern分析平台可在线运行GISTIC2.0,觉得安装太麻烦的老师,可以考虑在线分析,同样非常方便。不过这里我要解释一下其实上传自己的数据到在线工具,可能存在一种风险,就是数据被盗取成为在线软件开发者的数据库中的数据,获取一些数据信息,但是万事都不是绝对的,也有利好的一面,就是非常方便操作,哈哈!!
-
数据准备
三个文件格式与本地版的完全一样,这个不用过多考虑,后缀就是 .txt。
-
**seg file:**MaskedCopyNumberSegment(Tumor).txt
-
**markers file:**hg_marker_file.txt
-
**refgene file:**在线分析提供参考基因组
2. 注册登录
登录GISTIC2.0官网:
https://cloud.genepattern.org/gp/pages/login.jsf
这个网站需要注册一下,注册完成登录:
因为GenePattern下面有很多软件,需要选择GISTIC2.0:
===
===
3. 上传数据
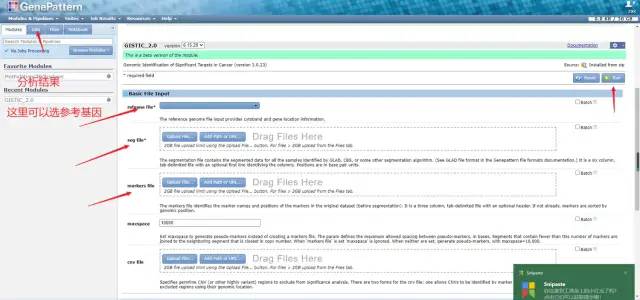
这三个文件必须要准备才能进行分析。点击Upload file 上传相关文件。参考基因组选择的是Hg38
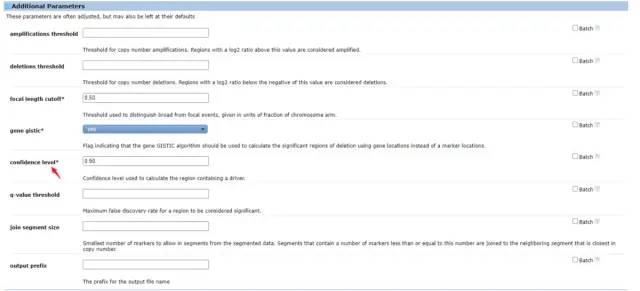
4. 选择性调整参数
5. 在线运行
点击RUN,就运行完成,一看,我天啊,总共生成了19个文件,跟本地运行的结果比较,貌似少了一些文件,但是重要的文件是完全一致的,这里就不再赘述了!
maftools展示结果
- 读取数据
读取GISTIC2.0输出的结果,四个文件包括:
-
all_lesions.conf_99.txt :识别到的拷贝数扩增和缺失的Peak区域;
-
amp_genes.conf_99.txt:识别到的拷贝数扩增的Peak区域及区域内涉及到的基因;
-
del_genes.conf_99.txt:识别到的拷贝数缺失的Peak区域及区域内涉及到的基因;
-
scores.gistic:该算法的打分结果,可导入IGV进行可视化。
library(maftools)
#path to TCGA LAML MAF file
laml.maf = system.file('extdata', 'tcga_laml.maf.gz', package = 'maftools')
#clinical information containing survival information and histology. This is optional
laml.clin = system.file('extdata', 'tcga_laml_annot.tsv', package = 'maftools')
laml = read.maf(maf = laml.maf, clinicalData = laml.clin)
all.lesions <- system.file("extdata", "all_lesions.conf_99.txt", package = "maftools")
amp.genes <- system.file("extdata", "amp_genes.conf_99.txt", package = "maftools")
del.genes <- system.file("extdata", "del_genes.conf_99.txt", package = "maftools")
scores.gis <- system.file("extdata", "scores.gistic", package = "maftools")
laml.gistic = readGistic(gisticAllLesionsFile = all.lesions, gisticAmpGenesFile = amp.genes, gisticDelGenesFile = del.genes, gisticScoresFile = scores.gis, isTCGA = TRUE)
2. 三种方式可以展示GISTIC2.0输出的结果
i. genome plot
gisticChromPlot(gistic = laml.gistic, markBands = "all")
ii. Bubble plot
gisticBubblePlot(gistic = laml.gistic)
iii. oncoplot
这类似于oncoplot,除了CNV。可以再次根据注释对矩阵进行排序(如果有的话)。下图是根据FAB分类对LAML进行排序的gistic结果。图中显示,7q缺失在M4亚型中几乎不存在,而在其他亚型中普遍存在。
gisticOncoPlot(gistic = laml.gistic, clinicalData = getClinicalData(x = laml), clinicalFeatures = 'FAB_classification', sortByAnnotation = TRUE, top = 10)
怎么样,大家觉着难嘛?基于linux上操作这些软件,带有命令的还是需要有一定的基础才能实现,若老师觉得根本搞不定,找桓峰基因,我们24小时在线,等着您,帮您解决问题!!!
**References:
**
1. Mermel CH, Schumacher SE, Hill B, Meyerson ML, Beroukhim R, Getz G. GISTIC2.0 facilitates sensitive and confident localization of the targets of focal somatic copy-number alteration in human cancers. Genome Biol. 2011;12(4):R41. doi:10.1186/gb-2011-12-4-r41
2. Mayakonda A, Lin DC, Assenov Y, Plass C, Koeffler HP. 2018. Maftools: efficient and comprehensive analysis of somatic variants in cancer. Genome Resarch. PMID: 30341162
