windows pwn
环境搭建
checksec
winchecksec
winchecksec 是 windows 版的 checksec ,不过有时候结果不太准确。

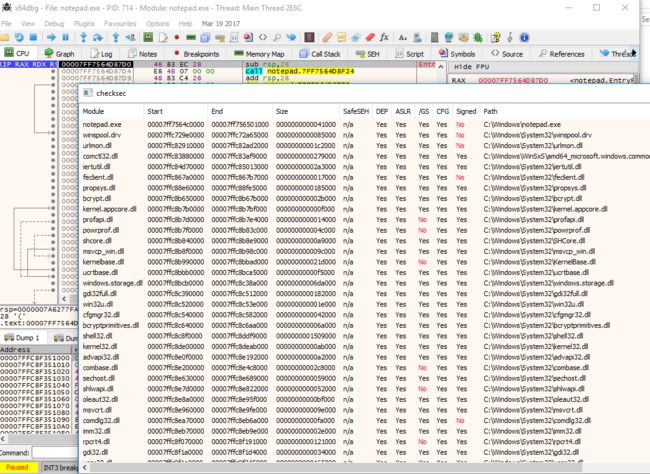
checksec(x64dbg)
x64dbg 的插件 checksec 检查效果比较准确,并且可以连同加载的 dll 一起检测。
将 release 的插件按 32 和 64 位分别放到 x32dbg 和 x64dbg 的 plugins 目录,如果找不到 plugins 目录则打开调试器然后关闭就出现了。
winpwn
winpwn 是 windows 平台上类似 pwntools 的 python 库,使用这个库可以更方便的编写 exp 。
winpwn 支持如下功能:
1. process
   + process("./pwn")
   + process(["./pwn","argv[1]","argv[2]"])
   + p.readm(addr,n) # read process memory
   + p.writem(addr,con="") # write process memory
2. remote
   + remote("127.0.0.1", 65535)

3. context
   + context.timeout=512
   + context.debugger="gdb" # or "windbg" or "x64dbg"
   + context.endian="little"
   + context.log_level="" # or "debug"
   + context.terminal=[ ]
   + context.newline="\r\n"
   + context.arch="i386" # or "amd64"
   + content.pie=None
   + context.dbginit=None # used to set debugger init script
   + context.windbg=None # set debugger path, or use .winpwn to find debugger path
   + context.windbgx=None
   + content.gdb=None
   + context.x64dbg=None
   + context.nocolor=None # if set, will print non-colorful output to terminal

4. dbg: windbgx, windbg, gdb, x64dbg
   + windbgx.attach(p,script="bp 0x401000")
   + windbg.attach(p,script="bp 0x401000")
   + gdb.attach(p, script="b *0x401000")
   + x64dbg.attach(p) #can not parse script file yet

5. disable PIE:
   + PIE(exe_fpath="")
   + NOPIE(exe_fpath="")
6. asm/disasm:
   + asm("push ebp")
   + disasm("\x55")

7. winfile(fpath="./main.exe"):
   + winfile.symbols["CreateProcessA"] # return symbol's IAT/EAT offset of CreateProcessA by image base
8. wincs(ip,port)
   + wincs(ip=None,port=512): run a server to asm/disasm in remote machine for client where does not install keystone/capstone
   + wincs(ip='123.123.123.123',512): create a client to connet to server
      + wincs.asm(asmcode='push ebp')
      + wincs.disasm(machinecode='\x55')
安装
这里我使用的是 python2 版本的 winpwn 。
pip install pefile
pip install keystone-engine
pip install capstone
pip install winpwn
添加功能
winpwn 中缺失了一些 pwntools 中的功能,这里我们修改 winpwn 库添加一下。
- sendline/sendlineafter
在winpwn.py的class tube(object):中添加如下两行:sendafter = lambda self, a, b: (self.recvuntil(a), self.send(b))[1] sendlineafter = lambda self, a, b: (self.recvuntil(a), self.sendline(b))[1] - search
将winfile.py替换为如下内容:
search 功能效果如下,这里from .misc import Latin1_decode import binascii import re import pefile class winfile(object): def __init__(self, fpath="", rebase=False): self._address = 0 self.imsyms = {} self.exsyms = {} self.symbols = {} self.path = fpath self.pe = pefile.PE(fpath) if rebase: self.address = self.pe.OPTIONAL_HEADER.ImageBase self.update(fpath) def update(self, fpath): if hasattr(self.pe, "DIRECTORY_ENTRY_IMPORT"): for entry in self.pe.DIRECTORY_ENTRY_IMPORT: # print(entry.dll) for imp in entry.imports: self.imsyms.update({Latin1_decode(imp.name): self._address + imp.address - self.pe.OPTIONAL_HEADER.ImageBase}) if hasattr(self.pe, "DIRECTORY_ENTRY_EXPORT"): for exp in self.pe.DIRECTORY_ENTRY_EXPORT.symbols: self.exsyms.update({Latin1_decode(exp.name): self._address + self.pe.DIRECTORY_ENTRY_EXPORT.struct.AddressOfFunctions + 4 * (exp.ordinal - 1)}) self.symbols.update(self.exsyms) self.symbols.update(self.imsyms) def search(self, needle, writable=False, executable=False): hex_needle = binascii.hexlify(needle) for section in self.pe.sections: if writable and not section.Characteristics & pefile.SECTION_CHARACTERISTICS['IMAGE_SCN_MEM_WRITE']: continue if executable and not section.Characteristics & pefile.SECTION_CHARACTERISTICS['IMAGE_SCN_MEM_EXECUTE']: continue start = section.PointerToRawData end = start + section.SizeOfRawData section_content = binascii.hexlify(self.pe.__data__[start:end]) for m in re.finditer(hex_needle, section_content): if m.start() % 2 != 0: continue offset = section.VirtualAddress + m.start() / 2 yield offset + self.address @property def address(self): return self._address @address.setter def address(self, base): self._address = base for sym in self.imsyms: self.imsyms.update({sym: base + self.imsyms[sym]}) for sym in self.exsyms: self.exsyms.update({sym: base + self.exsyms[sym]}) self.symbols.update(self.exsyms) self.symbols.update(self.imsyms)rebase决定是否按照 ImageBase 进行重定位。from winpwn import * context.arch = 'i386' pe = winfile("./stackoverflow.exe", rebase=True) print hex(pe.search(asm('push eax'), executable=True).next()) # 0x4117cd - 设置调试器路径
可以在context.py中设置调试器路径,这样就不用每次写脚本都设置了。这里我的调试器都添加到环境变量了,所以不需要写完整路径。gdb = "gdb" windbg = "WinDbgX" windbgx = "WinDbgX" x64dbg = "x64dbg" if arch == "amd64" else "x32dbg"
安装 ConEmu
如果在脚本使用 winpwn 的 attach 功能大概率会报错,通过调试脚本可知原因是没有安装 ConEmu 。
下载 ConEmu 安装,然后把安装路径添加到环境变量。由于 winpwn 的启动调试器的命令是 ConEmu ...,因此最好将安装的 ConEmu64.exe 复制一个改名为 ConEmu.exe 。
注意如果使用 xxx 调试器需要设置路径 context.xxx=''path to xxx" 然后使用 xxx.attach(p) 来使用该调试器附加进程。例如下面这个使用 gdb 调试器的例子:
from winpwn import *

context.arch = 'i386'
context.gdb = 'gdb'
pe = winfile("./stackoverflow.exe")
p = process(pe.path)
gdb.attach(p)
p.interactive()

windbg
安装 windbg
直接在微软商店下载 WinDbg Preview 。

如果 WinDbgX 已经添加到环境变量就可以使用在 winpwn 脚本中用 windbg 附加调试进程。
context.windbgx = 'WinDbgX'
windbgx.attach(p)
在 windbg 中 选择 setting->Debugging settings ,在 Default symbol path 一栏填上,其中 c:\mysymbols 可以换成其他路径。
srv*C:\mysymbols*https://msdl.microsoft.com/download/symbols
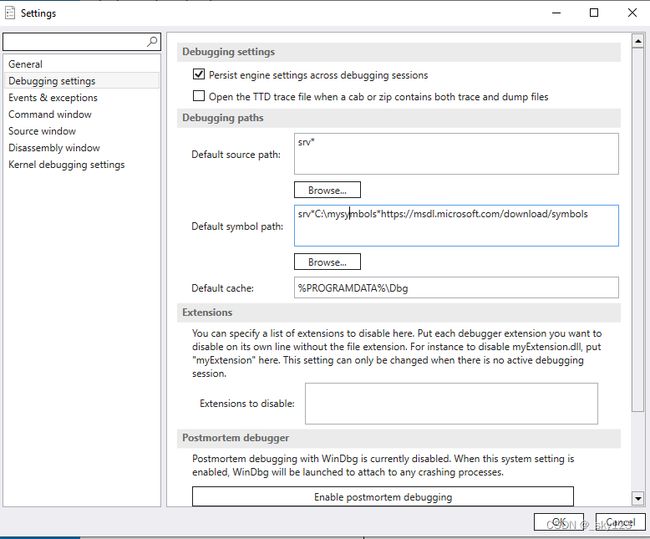
这样 windbg 下载的调试符号就可以保存到对应路径下,下一次调试就不用重新下载符号了。
另外 WinDbg 支持安装插件,比如 windbg-scripts 可以让 WinDbg 支持 !telescope 命令。
将 windbg-scripts 项目下载下来后,修改项目目录下的 Minfest 目录下的 config.xml ,将其中的 LocalCacheRootFolder 的路径改为 Minfest 目录的绝对路径。之后在 WinDbg 命令行中输入 .settings load c:\path\where\cloned\windbg-scripts\Manifest\config.xml 和 .settings save 然后重启 WinDbg 就可以使用 !telescope 命令。
0:004> !telescope 0x0168fdf4
Populating the VA space with modules..
Populating the VA space with TEBs & thread stacks..
Populating the VA space with the PEB..
0x0168fdf4|+0x0000: 0x76f335f9 (ntdll.dll (.text)) -> jmp ntdll!_DbgUiRemoteBreakin@4+0x42 (76f33602) ; xor eax,eax ; inc eax
0x0168fdf8|+0x0004: 0xe8b095a5 (Unknown)
0x0168fdfc|+0x0008: 0x76f335c0 (ntdll.dll (.text)) -> push 8 ; push 76F937F8h ; call ntdll!__SEH_prolog4 (76f17810)
0x0168fe00|+0x000c: 0x76f335c0 (ntdll.dll (.text)) -> push 8 ; push 76F937F8h ; call ntdll!__SEH_prolog4 (76f17810)
0x0168fe04|+0x0010: 0x00000000 (Unknown)
0x0168fe08|+0x0014: 0x0168fdf8 (Stack) -> 0xe8b095a5 (Unknown)
0x0168fe0c|+0x0018: 0x00000000 (Unknown)
0x0168fe10|+0x001c: 0x0168fe78 (Stack) -> 0x0168fe90 (Stack) -> 0xffffffff (Unknown)
0x0168fe14|+0x0020: 0x76efe8b0 (ntdll.dll (.text)) -> mov edi,edi ; push ebp ; mov ebp,esp
0x0168fe18|+0x0024: 0x9f215c7d (Unknown)
@$telescope(0x0168fdf4)
ret_sync 实现 ida 和 windbg 联动调试
ret_sync 可以把 windbg 的调试位置同步到 ida 上,配置方法如下:
-
将 ret_sync 项目下的
ext_ida文件加中的文件都复制到 IDA 的 plugins 文件夹下。 -
到这个网址下载
ret-sync-release-windbg-Win32和ret-sync-release-windbg-x64两个插件。 -
把下载好的
sync.dll和sync32.dll( 32 位文件夹下的sync.dll改名为sync32.dll),复制到C:\Users\username\AppData\Local\Microsoft\WindowsApps文件夹下(与 WinDbg 在同一目录)。旧版windbg插件安装,参考
-
把要调试的 exe 和 dll 都用 ida 打开,然后都选择 Edit->plugins->ret_sync 。
如果正常的话在 ida 的命令行中会看到如下输出:[sync] default idb name: stackoverflow.exe [sync] sync enabled [sync] cmdline: "C:\Python27\python.exe" -u "C:\Program Files\IDA_Pro_7.7\plugins\retsync\broker.py" --idb "stackoverflow.exe" [sync] module base 0x400000 [sync] hexrays #7.7.0.220118 found [sync] broker started [sync] plugin loaded [sync] << broker << connected to dispatcher [sync] << broker << dispatcher msg: add new client (listening on port 4730), nb client(s): 2 -
打开 WinDbg,选择 文件->Launch executable 或者附加进程进入调试状态,然后输入
!load sync,如果是调试 32 位程序则输入的是!load sync0:000> !load sync32 [sync] DebugExtensionInitialize, ExtensionApis loaded输入
!synchelp可以查看帮助,输入!sync让windbg上线,之后输入!idblist可以看到上线的 idb 。因为前面我打开了ntdll.dll和stackoverflow.exe并且都运行了 ret_sync 插件,因此这里可以看到ntdll.dll和stackoverflow.exe。0:000> !sync [sync] No argument found, using default host (127.0.0.1:9100) [sync] sync success, sock 0x76c [sync] probing sync [sync] sync is now enabled with host 127.0.0.1 0:000> !idblist [0] ntdll.dll [1] stackoverflow.exe实际上这时候 ida 和 Windbg 已经同步了。结合 ida 的 Synchronize with 就可以实现 windbg 与 ida 反编译结果的同步。
另外可以在 exp 脚本上写好同步命令,这样附加进程后就能与 ida同步。
windbgx.attach(p,"!load sync32\n!sync\nbp 00700000+0119B7\n")
常用命令
windbg 的 LocalHelp 可以查看帮助文档。
寄存器
r 查看寄存器状态和当前运行指令
0:000> r
eax=00000210 ebx=003ac000 ecx=001ef9d0 edx=00000000 esi=001efbd4 edi=001efda8
eip=007119b7 esp=001efbd4 ebp=001efda8 iopl=0         nv up ei pl nz ac pe nc
cs=0023  ss=002b  ds=002b  es=002b  fs=0053  gs=002b             efl=00000216
stackoverflow+0x119b7:
007119b7 ff1574b17100    call    dword ptr [stackoverflow+0x1b174 (0071b174)] ds:002b:0071b174={ucrtbased!getchar (7aebcf70)}
地址
lmi查看进程加载的各个模块。通过这个命令可以获得模块的加载基址。0:000> lmi start end module name 00700000 00720000 stackoverflow C (no symbols) 753e0000 75652000 KERNELBASE (deferred) 75b20000 75c10000 KERNEL32 (pdb symbols) C:\Windows\System32\KERNEL32.DLL 76e80000 7702f000 ntdll (pdb symbols) C:\Windows\SYSTEM32\ntdll.dll 7add0000 7adee000 VCRUNTIME140D (deferred) 7adf0000 7af94000 ucrtbased (private pdb symbols) C:\Windows\SYSTEM32\ucrtbased.dll!address查看更详细的段信息,类似 pwndbg 的vmmap功能。0:000> !address Mapping file section regions... Mapping module regions... Mapping PEB regions... Mapping TEB and stack regions... Mapping heap regions... Mapping page heap regions... Mapping other regions... Mapping stack trace database regions... Mapping activation context regions... BaseAddr EndAddr+1 RgnSize Type State Protect Usage ----------------------------------------------------------------------------------------------- + 0 60000 60000 MEM_FREE PAGE_NOACCESS Free + 60000 63000 3000 MEM_MAPPED MEM_COMMIT PAGE_READONLY MappedFile "\Device\HarddiskVolume3\Windows\System32\l_intl.nls" + 63000 70000 d000 MEM_FREE PAGE_NOACCESS Free + 70000 80000 10000 MEM_MAPPED MEM_COMMIT PAGE_READWRITE MappedFile "PageFile" + 80000 83000 3000 MEM_MAPPED MEM_COMMIT PAGE_READONLY MappedFile "\Device\HarddiskVolume3\Windows\System32\l_intl.nls" + 83000 90000 d000 MEM_FREE PAGE_NOACCESS Free + 90000 af000 1f000 MEM_MAPPED MEM_COMMIT PAGE_READONLY Other [API Set Map] ...!address 地址查看某个地址所在段信息。0:000> !address 75bd0000 Usage: Image Base Address: 75bd0000 End Address: 75bd1000 Region Size: 00001000 ( 4.000 kB) State: 00001000 MEM_COMMIT Protect: 00000004 PAGE_READWRITE Type: 01000000 MEM_IMAGE Allocation Base: 75b20000 Allocation Protect: 00000080 PAGE_EXECUTE_WRITECOPY Image Path: C:\Windows\System32\KERNEL32.DLL Module Name: KERNEL32 Loaded Image Name: C:\Windows\System32\KERNEL32.DLL Mapped Image Name: More info: lmv m KERNEL32 More info: !lmi KERNEL32 More info: ln 0x75bd0000 More info: !dh 0x75b20000 Content source: 1 (target), length: 1000
断点
bp 地址在某地址处下断点,另外常见命令如bp ucrtbased!system可以在system函数下断点。bp "在某地址处下条件断点,例如" bp 00401234 "eax==0"。bl查看断点,直接点击Disable来暂时停用断点,点击Clear清除断点。0:000> bp ucrtbased!system 0:000> bl 0 e Disable Clear 007119b7 0001 (0001) 0:**** stackoverflow+0x119b7 1 e Disable Clear 7ae6b8f0 [minkernel\crts\ucrt\src\desktopcrt\exec\system.cpp @ 79] 0001 (0001) 0:**** ucrtbased!system
内存
-
dq八字节查看,dd四字节查看,dw两字节查看,dc一字节查看。0:000> dc 001efbd4 001efbd4 00711348 00711348 003ac000 cccccccc H.q.H.q...:..... 001efbe4 cccccccc cccccccc cccccccc cccccccc ................ 001efbf4 cccccccc cccccccc cccccccc cccccccc ................ 001efc04 cccccccc cccccccc cccccccc cccccccc ................ 001efc14 cccccccc cccccccc cccccccc cccccccc ................ 001efc24 cccccccc cccccccc cccccccc cccccccc ................ 001efc34 cccccccc cccccccc cccccccc cccccccc ................ 001efc44 cccccccc cccccccc cccccccc cccccccc ................ -
u 地址查看某地址处的汇编,u查看程序运行位置的汇编,uf会一值反汇编到 ret 指令。0:000> u 00700000+119b7 stackoverflow+0x119b7: 007119b7 ff1574b17100 call dword ptr [stackoverflow+0x1b174 (0071b174)] 007119bd 3bf4 cmp esi,esp 007119bf e85df8ffff call stackoverflow+0x11221 (00711221) 007119c4 33c0 xor eax,eax 007119c6 52 push edx 007119c7 8bcd mov ecx,ebp 007119c9 50 push eax 007119ca 8d15ec197100 lea edx,[stackoverflow+0x119ec (007119ec)] -
dt structure [address]把 address 当成 structure 类型的结构体解析,如果不加 address 就会单纯打印出结构体。
例如已知 4 个堆,想查看第一个 heap 的 _HEAP ,因为 _HEAP 就在 heap 的开头,所以第一个 heap 的 _HEAP 就是 23c9cb00000 。0:001> !heap Heap Address NT/Segment Heap 23c9cb00000 NT Heap 23c9c9d0000 NT Heap 23c9e530000 NT Heap 23c9e990000 NT Heap 0:001> dt _heap 23c9cb00000 ntdll!_HEAP +0x000 Segment : _HEAP_SEGMENT +0x000 Entry : _HEAP_ENTRY +0x010 SegmentSignature : 0xffeeffee +0x014 SegmentFlags : 2 +0x018 SegmentListEntry : _LIST_ENTRY [ 0x0000023c`9cb00120 - 0x0000023c`9cb00120 ] +0x028 Heap : 0x0000023c`9cb00000 _HEAP +0x030 BaseAddress : 0x0000023c`9cb00000 Void +0x038 NumberOfPages : 0xff +0x040 FirstEntry : 0x0000023c`9cb00740 _HEAP_ENTRY +0x048 LastValidEntry : 0x0000023c`9cbff000 _HEAP_ENTRY +0x050 NumberOfUnCommittedPages : 0xce +0x054 NumberOfUnCommittedRanges : 1 +0x058 SegmentAllocatorBackTraceIndex : 0 ... -
s -a 7adf0000 L100000 "cmd.exe"搜索字符串-a表示搜索 ascii 码6a450000表示搜索起始位置L100000表示搜索范围是 100000 字节"cmd.exe"表示搜索内容为 “cmd.exe”
效果如下:
0:000> s -a 7adf0000 L100000 "cmd.exe"
7ae360ec  63 6d 64 2e 65 78 65 00-69 00 73 00 6c 00 65 00  cmd.exe.i.s.l.e.
调试
g继续运行p步过t步入k查看 trace back
运算
?0074fbf4-74fa68 可以进行简单运算。
查看符号
x ucrtbased!_read 打印 read 函数的地址和其他信息。这个命令支持通配符,比如 x ucrtbased!*read 。
0:000> x ucrtbased!_read
7af371d0          ucrtbased!_read (int, void *, unsigned int)
0:000> x ucrtbased!_system
7ae6b8f0          ucrtbased!system (char *)
0:000> x ucrtbased!*system
7ae6b910          ucrtbased!_wsystem (wchar_t *)
7ae88730          ucrtbased!_o__wsystem (wchar_t *)
7ae6b8f0          ucrtbased!system (char *)
7ae8adb0          ucrtbased!_o_system (char *)
SEH
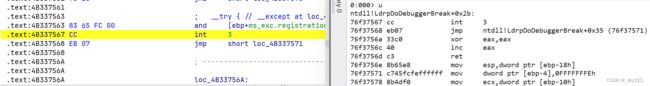
触发异常后,输入 !exchain 可以查看 seh chain(有一种错误说法是 TryLevel 设为 0 后就可以用 !exchain 查看,实际上必须是触发异常后查看的 chain 才是 seh chain)
EXCEPTION_REGISTRATION 依次连接
最后一个 EXCEPTION_REGISTRATION 的 next 为 0xFFFFFFFF ,exceptionhandler 为 ntdll!FinalExceptionHandler 。
PEB
PEB 与 TEB 的相对偏移固定,使用 .process 或者 r $peb 查看进程的 PEB 地址,随后使用 dt _PEB peb_addr 查看进程的 PEB 信息。
0:000> .process
Implicit process is now 00995000
0:000> r $peb
$peb=00995000
0:000> dt _PEB 00995000
ntdll!_PEB
   +0x000 InheritedAddressSpace : 0 ''
   +0x001 ReadImageFileExecOptions : 0 ''
   +0x002 BeingDebugged    : 0x1 ''
   +0x003 BitField         : 0x4 ''
   ...
!peb 查看 PEB 的具体内容,其中 Ldr 的地址为76facb00,即 ntdll!pebldr 地址。
0:000> !peb
PEB at 00995000
    InheritedAddressSpace:    No
    ReadImageFileExecOptions: No
    BeingDebugged:            Yes
    ImageBaseAddress:         00700000
    NtGlobalFlag:             0
    NtGlobalFlag2:            0
    Ldr                       76facb00
    ...
0:000> dc ntdll!pebldr
76facb00  00000030 00000001 00000000 00e12360  0...........`#..
76facb10  00e18418 00e12368 00e18420 00e12278  ....h#.. ...x"..
76facb20  00e182d0 00000000 00000000 00000000  ................
76facb30  00000002 00000000 00000000 00000000  ................
76facb40  00000000 00000000 00000000 00000000  ................
76facb50  00000000 00000000 00000000 00000000  ................
76facb60  00000000 00000000 00000000 00000000  ................
76facb70  00000000 00000000 00000000 00000000  ................
ntdll!pebldr 附近可以找到 PEB 结构体中的地址(所以可以依次寻找 ntdll->PEB->TEB)。

TEB
堆
远程环境
基础知识
PE 文件
常见 dll
- ntdll.dll
- 包含未公开 API
- 系统调用入口
- 各版本间不同
- kernel32.dll
- 堆,虚拟内存,文件 I/O 相关的 API
- 多数函数只是 ntdll 函数的封装
- API 几乎不会修改
- mscrtxxx.dll
- 类似 linux 中的 glibc
目前调试过程遇到的调用关系是下图这样的。
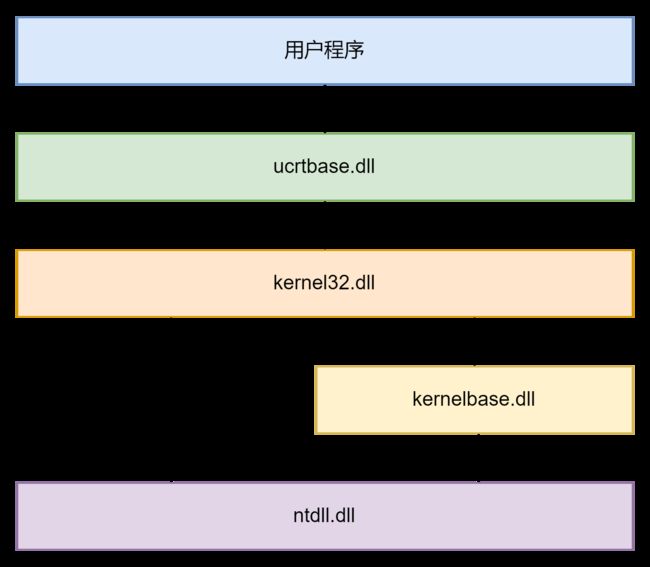
mscrtxxx.dll 和 ucrtbase.dll 的区别:
-
mscrtxxx.dll:Microsoft Visual C++ 运行时库,包含了用于支持早期的 Visual C++ 版本的函数和变量。
-
ucrtbase.dll:Universal C 运行时库,是 Windows 10 中默认的 C 运行时库。它包含了许多标准 C 库函数的实现,以及一些新的安全函数,可以提高代码的安全性和可靠性。
常见结构
TEB
TEB(Thread Environment Block)是 Windows 操作系统中的一个线程私有的数据结构,用于存储线程相关的信息。每个线程都有一个对应的 TEB 。32 位程序 FS 寄存器指向当前线程的 TEB ,64 位程序 FS 寄存器指向 GS Base TEB ,而 GS Base TEB 存放的是指向当前线程的 TEB 的指针。
使用 r $teb 查看进程的 TEB 地址,!teb 可以查看 TEB 详细信息。
0:000> r $teb
$teb=00998000
0:000> !teb
TEB at 00998000
    ExceptionList:        00affcf0
    StackBase:            00b00000
    StackLimit:           00afd000
    SubSystemTib:         00000000
    FiberData:            00001e00
    ArbitraryUserPointer: 00000000
    Self:                 00998000
    EnvironmentPointer:   00000000
    ClientId:             00003638 . 00000ae0
    RpcHandle:            00000000
    Tls Storage:          00e1acb8
    PEB Address:          00995000
    LastErrorValue:       0
    LastStatusValue:      0
    Count Owned Locks:    0
    HardErrorMode:        0
TEB 的开头是一个 NT_TIB 结构,具体如下:
0:000> dt _nt_tib
ntdll!_NT_TIB
   +0x000 ExceptionList    : Ptr32 _EXCEPTION_REGISTRATION_RECORD
   +0x004 StackBase        : Ptr32 Void
   +0x008 StackLimit       : Ptr32 Void
   +0x00c SubSystemTib     : Ptr32 Void
   +0x010 FiberData        : Ptr32 Void
   +0x010 Version          : Uint4B
   +0x014 ArbitraryUserPointer : Ptr32 Void
   +0x018 Self             : Ptr32 _NT_TIB
NT_TIB 中一些重要的字段的解释:
ExceptionList:指向当前线程的异常处理器链表的头部。当线程发生异常时,系统会将异常处理器添加到该链表中,以便进行异常处理。StackBase和StackLimit:分别指向线程栈的起始地址和结束地址。这是我们我们泄露栈基址的一个途径。Self:指向当前 TEB 的指针。对于任何 TEB,该字段的值应该等于 TEB 的地址。
PEB
PEB(Process Environment Block)是 Windows 操作系统中的一个数据结构,它包含了进程的上下文信息。每个进程都有一个唯一的 PEB,它被存储在进程的用户模式地址空间中。
SEH
SEH(Structured Exception Handling,结构化异常处理)是 Windows 操作系统中的一种异常处理机制。
常见保护
DEP
- 类似 Linux 上的 NX 保护,可以理解为内存的可写和可执行不共存。
- 绕过方法
- ROP
- VirtualProtect (类似于 Linux 的 mprotect)
ASLR
- 模块加载基址随机而不是安装 ImageBase 加载,每次重启靶机才会改变,而不是每次运行程序时改变。
- TEB/PEB/heap/stack 的基址每次运行程序都会改变
- 一些内核相关的 dll 例如 ntdll.dll 和 kernel32.dll 在所有进程中基址相同
- 绕过方法
- 泄露地址
- 一些 dll 的加载基址在所有进程都相同,因此可以在另一个进程中泄露基址。
- 模块加载基址每次重启才会改变,因此只要靶机不重启不必每次运行程序时泄露基址。
- 爆破
- 由于在 32 位程序中地址只随机 8 字节,因此爆破有 1/256 的几率成功。
- 泄露地址
GS
- 与 Linux 的 Canary 相似,另外还会再 局部变量的前后填充
\xcc。 - 绕过方法
- 泄露
- SEH