EFK部署及日志收集分析
EFK 日志处理流程

本文介绍以下内容
- 通过rsyslog收集本机所有日志
- 通过filebeat收集日志,给到elasticsearch
- Elasticsearch分析日志
- Elasticsearch将分析结果给到kibana
- 通过EFK收集apache日志并分析
通过rsyslog收集本机所有日志
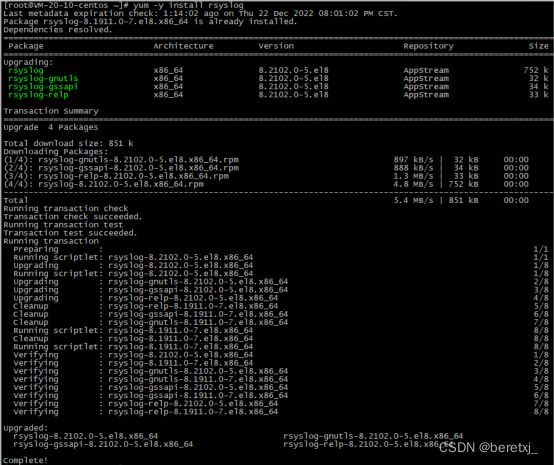
先安装rsyslog,yum -y install rsyslog
然后修改配置文件
修改配置文件
[root@VM-20-10-centos ~]# vim /etc/rsyslog.conf
解封2行
module(load="imudp") # needs to be done just once
input(type="imudp" port="514")
新增一行
# Save boot messages also to boot.log
local7.* /var/log/boot.log
#以下为新增,即将所有日志都收集到一个文件
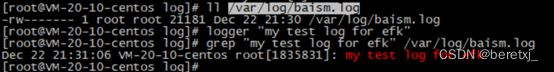
*.* /var/log/baism.log
最后启动rsyslog, systemctl restart rsyslog
安装EFK
首先安装filebeat
1)导入KEY
[root@VM-20-10-centos ~]# rpm --import https://packages.elastic.co/GPG-KEY-elasticsearch

2)设置yum仓库
[root@VM-20-10-centos ~]# cat /etc/yum.repos.d/elastic.repo
[elastic-6.x]
name=Elastic repository for 6.x packages
baseurl=https://artifacts.elastic.co/packages/6.x/yum
gpgcheck=1
gpgkey=https://artifacts.elastic.co/GPG-KEY-elasticsearch
enabled=1
autorefresh=1
type=rpm-md

3)安装
[root@VM-20-10-centos ~]# yum install filebeat
配置文件
filebeat.inputs:
- type: log
  enabled: true
  paths:
    - /var/log/baism.log
filebeat.config.modules:
  path: ${path.config}/modules.d/*.yml
  reload.enabled: false
setup.template.settings:
  index.number_of_shards: 3
setup.kibana:
output.elasticsearch:
  hosts: ["10.0.20.10:9200"]
processors:
  - add_host_metadata: ~
  - add_cloud_metadata: ~
最后启动filebeat,systemctl restart filebeat
![]()
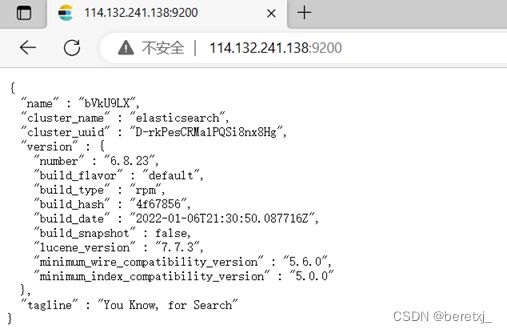
安装elasticsearch
直接yum安装,yum install -y elasticsearch
然后修改配置文件
修改配置文件/etc/elasticsearch/elasticsearch.yml
# Set the bind address to a specific IP (IPv4 or IPv6):
#
network.host: 0.0.0.0
#
# Set a custom port for HTTP:
#
http.port: 9200
最后启动

![]()
安装kibana
yum安装及配置


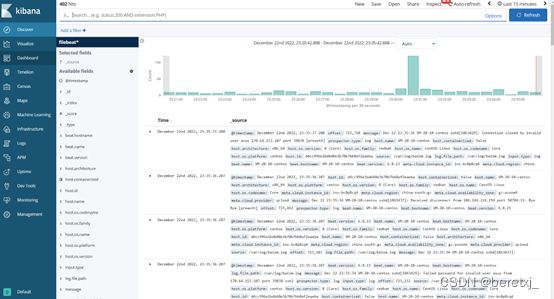
kibana展示rsyslog的日志
由于前面已经配置了filebeat手机rsyslog的日志,然后filebeat将收集的日志发送到elasticsearch,最后kibana从el中读取日志数据进行展示


优化rsyslog日志采集
因为系统日志量非常巨大,所以只收集部分日志错误、警告、ssh信息
修改filebeat的配置文件
[root@VM-20-10-centos filebeat]# egrep -v “#|^$"/etc/filebeat/filebeat.yml
filebeat.inputs:
- type: log
enabled: true
paths:
-/var/log/baism.log
include_lines: [^ERR",'AWARN",'sshd"]
filebeat.config.modules:
path: ${path.config}/modules.d/".yml
reload.enabled: false
setup.template.settings:
index.number_of_shards: 3
setup.kibana:
output.elasticsearch:
hosts: ["10.0.20.10:9200"]

清理旧数据
以上已经可以收集系统数据,现在我们进一步,收集apache日志。
为了方便实验,我们先将之前的旧数据都删除掉。
清理kibana数据如下图所示
清理elasticsearch数据
##查看数据
[root@VM-20-10-centos ~]# curl 127.0.0.1:9200/_cat/indices
yellow open filebeat-6.8.23-2022.12.23 nNmwKiX6RmSuuHJOgPSi2g 3 1 39314 0 18.2mb 18.2mb
green open kibana_sample_data_flights nvfNJ0KTTtyFDhjKeiUXdg 1 0 13059 0 6.4mb 6.4mb
yellow open filebeat-6.8.23-2022.12.22 NbfgMSpbRs2Rq0maxMhBJw 3 1 5447 0 1.3mb 1.3mb
green open .kibana_1 UTP1BQc-SnSabDhnI_DAaA 1 0 28 1 153.9kb 153.9kb
green open .kibana_task_manager 69EZCFAxQXOEscel75IbZw 1 0 2 0 13.3kb 13.3kb
green open .security-6 DVeM055ES_qzcuajd4bmlQ 1 0 10 0 49kb 49kb
##清除数据
[root@VM-20-10-centos ~]# curl -XDELETE 127.0.0.1:9200/filebeat-6.8.23-2022.12.22
{"acknowledged":true}
修改filebeat配置,使其可以按照json的apache日志收集日志
- type: log

  # Change to true to enable this input configuration.
  enabled: true

  # Paths that should be crawled and fetched. Glob based paths.
  paths:
    - /data/apache/log/access.log
  #- c:\programdata\elasticsearch\logs\*
  json.keys_under_root: true
  json.overwrite_keys: true
json.keys_under_root: true
json.overwrite_keys: true
默认这个值是FALSE的,也就是我们的json日志解析后会被放在json键上。设为TRUE,所有的keys就会被放到根节点。
是否要覆盖原有的key,这是关键配置,将keys_under_root设为TRUE后,再将overwrite_keys也设为TRUE,就能把flebeat默认的key值给覆盖了。
修改apache配置,使其日志为json格式
配置文件新增:
LogFormat "{ \
           \"@timestamp\": \"%{%Y-%m-%dT%H:%M:%S%z}t\", \
           \"@version\": \"1\", \
           \"tags\":[\"apache\"], \
           \"message\": \"%h %l %u %t \\\"%r\\\" %>s %b\", \
           \"clientip\": \"%a\", \
           \"duration\": %D, \
           \"status\": %>s, \
           \"request\": \"%U%q\", \
           \"urlpath\": \"%U\", \
           \"urlquery\": \"%q\", \
           \"bytes\": %B, \
           \"method\": \"%m\", \
           \"site\": \"%{Host}i\", \
           \"referer\": \"%{Referer}i\", \
           \"useragent\": \"%{User-agent}i\" \
          }" apache_json
修改
customLog " logs/access_log" apache_json
重启apache后检查日志输出

重启filebeat,并删掉旧的日志索引
[root@VM-20-10-centos filebeat]# systemctl restart filebeat
[root@VM-20-10-centos ~]# curl -XDELETE 127.0.0.1:9200/filebeat*
{"acknowledged":true}[root@VM-20-10-centos ~]#
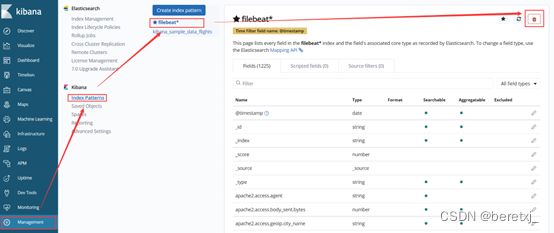
在kibana删掉filebeat*索引,重建

可以看到kibana已经可以展示apache日志,并且里面的各个http访问信息都是按照关键字进行索引的
将apahce日志可视化
如下操作即可


这里按照访问ip分类画图

保存这个视图,并加入仪表盘中

通过以上操作,就完成了EFK的部署,及初步的操作。