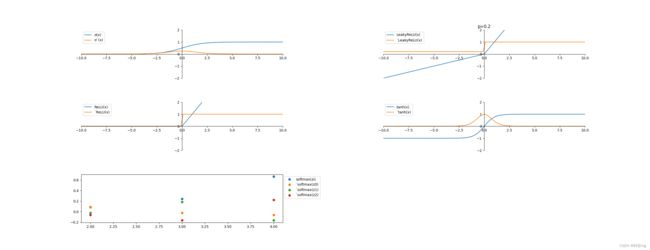
常用激活函数及偏导
derivative.py
import numpy as np
import matplotlib.pyplot as plt
plt.subplots_adjust(hspace=0.5 , wspace=0.5)
rows = 3
cols = 2
def plot_style(ax):
ax.spines['top'].set_visible(False)
ax.spines['right'].set_visible(False)
ax.spines['bottom'].set_position(('axes', 0.5))
ax.spines['left'].set_position(('axes', 0.5))
plt.xlim(-10,10)
plt.ylim(-2,2)
x=np.linspace(-10,10,100)
def Sigmoid(x) :
a = 1/(1+np.exp(-x))
return a
def d_Sigmoid(x):
a = Sigmoid(x)*(1-Sigmoid(x))
return a
graph = plt.subplot(rows,cols,1)
plot_style(graph)
plt.plot(x,Sigmoid(x),label="σ(x)")
plt.plot(x,d_Sigmoid(x),label="σ`(x)")
plt.legend()
def LeakyReLU(x,p):
cond = x>=0
a = np.where(cond,x,p*x)
return a
def d_LeakyReLU(x,p):
cond = x>=0
a = np.where(cond,1,p)
return a
x=np.linspace(-10,10,100)
graph = plt.subplot(rows,cols,2)
plot_style(graph)
p = 0.2
plt.plot(x,LeakyReLU(x,p),label='LeakyReLU(x)')
plt.plot(x,d_LeakyReLU(x,p),label='`LeakyReLU(x)')
plt.title(f'p={p}')
plt.legend()
def ReLU(x) :
a = LeakyReLU(x,0)
return a
def d_ReLU(x) :
a = np.array(x,copy=True)
a[x<0] = 0
a[x>=0] = 1
return a
x=np.linspace(-10,10,100)
graph = plt.subplot(rows,cols,3)
plot_style(graph)
plt.plot(x,ReLU(x),label='ReLU(x)')
plt.plot(x,d_ReLU(x),label='`ReLU(x)')
plt.legend()
def tanh(x):
a = 2*Sigmoid(2*x) - 1
return a
def d_tanh(x):
b = np.power(tanh(x),2)
a = 1 - b
return a
x=np.linspace(-10,10,100)
graph = plt.subplot(rows,cols,4)
plot_style(graph)
plt.plot(x,tanh(x),label='tanh(x)')
plt.plot(x,d_tanh(x),label='`tanh(x)')
plt.legend()
x = [2,3,4]
def softmax(x):
expx = np.exp(x)
a = expx / np.sum(expx)
return a
def d_softmax(x):
p = softmax(x)
count = len(x)
out = []
for i in range(count) :
for j in range(count) :
ret = 0
if j==i:
ret = p[i]*(1-p[j])
print(f'dp[{i}]/dz[{j}] = p[{i}]*(1-p[{j})] = {ret}')
else :
ret = -p[i]*p[j]
print(f'dp[{i}]/dz[{j}] = -p[{i}]*p[{j}] = {ret}')
out.append(ret)
return out
plt.subplot(rows,cols,5)
plt.scatter(x,softmax(x),label=f'softmax(zi)')
d_out = d_softmax(x)
len = len(x)
for i in range(len):
plt.scatter(x,d_out[len*i:len*(i+1)],label=f'`softmax(z{i})')
plt.legend(loc='upper left', bbox_to_anchor=(1, 1))
plt.show()