XGBoost实例——皮马印第安人糖尿病预测和特征筛选
利用皮马印第安人糖尿病数据集来预测皮马印第安人的糖尿病,以下是数据集的信息:
- Pregnancies:怀孕次数
- Glucose:葡萄糖
- BloodPressure:血压 (mm Hg)
- SkinThickness:皮层厚度 (mm)
- Insulin:胰岛素 2小时血清胰岛素(mu U / ml )
- BMI:体重指数 (体重/身高)^2
- DiabetesPedigreeFunction:糖尿病谱系功能
- Age:年龄 (岁)
- Outcome:目标值 (0或1)
导入模块
# 导入模块包
import pandas as pd
from sklearn.model_selection import train_test_split
import xgboost as xgb
import warnings
warnings.filterwarnings('ignore')
from sklearn.metrics import roc_auc_score, roc_curve, confusion_matrix, classification_report
import matplotlib.pyplot as plt
import seaborn as sns
读取数据
df = pd.read_csv('pima-indians-diabetes.csv')
print(df.info())
df.head()
直接进行预测
# 数据划分
feature_columns = ['Pregnancies', 'Glucose', 'BloodPressure', 'SkinThickness', 'Insulin', 'BMI', 'DiabetesPedigreeFunction', 'Age']
X = df[feature_columns]
y = df['Outcome']
train_X, test_X, train_y, test_y = train_test_split(X,y,random_state=7,test_size=0.2)
# 模型设置和训练
xgb_clf = xgb.XGBClassifier(n_estimators=20, max_depth=4,learning_rate=0.1,subsample=0.7,colsample_bytree=0.7)
xgb_clf.fit(train_X, train_y)
pred_y = xgb_clf.predict(test_X)
prob_y = xgb_clf.predict_proba(test_X)[:,1]
prob_train_y = xgb_clf.predict_proba(train_X)[:,1]

# 模型评估
auc_score = roc_auc_score(test_y, pred_y)
auc_score_train = roc_auc_score(train_y, prob_train_y)
fpr, tpr,_ = roc_curve(test_y, prob_y)
fpr_tr, tpr_tr,_ = roc_curve(train_y, prob_train_y)

# 绘制roc曲线
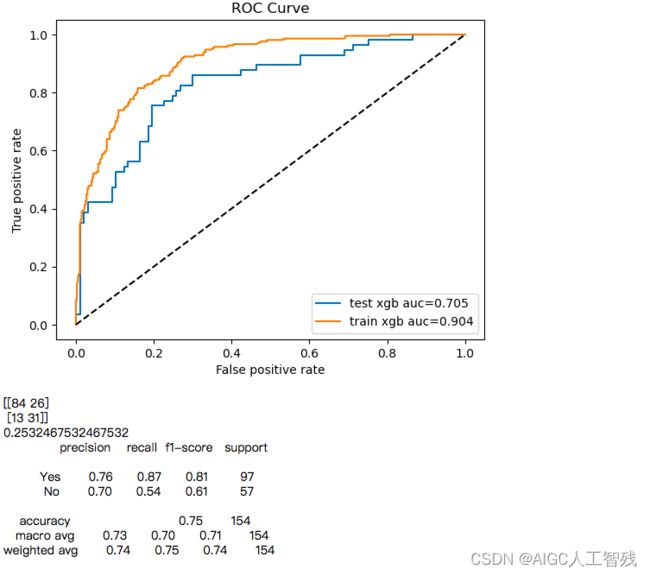
plt.plot(fpr,tpr,label = 'test xgb auc=%0.3f'%auc_score) #绘制训练集ROC
plt.plot(fpr_tr,tpr_tr,label = 'train xgb auc=%0.3f'%auc_score_train) #绘制验证集ROC
plt.plot([0,1],[0,1],'k--')
plt.xlabel('False positive rate')
plt.ylabel('True positive rate')
plt.title('ROC Curve')
plt.legend(loc = 'best')
plt.show()
print(confusion_matrix(pred_y,test_y))
print((pred_y!=test_y).sum()/float(test_y.shape[0]))
print(classification_report(test_y,pred_y,  target_names=['Yes','No']))
用xgboost对特征进行筛选,由于上面已经直接用于分类了,所以我们可直接提取出特征的指标。
# 使用xgboost进行特征筛选
temp=pd.DataFrame()
temp['feature_name'] = feature_columns
temp['feature_importance'] = xgb_clf.feature_importances_
temp.sort_values('feature_importance', ascending=False)
# 使用大于0.1的特征进行训练
feature_lst = ['Glucose','BMI','Age','Insulin']
X = df[feature_lst]
y = df['Outcome']
train_X, test_X, train_y, test_y = train_test_split(X,y,random_state=7,test_size=0.2)
# 模型设置和训练
xgb_clf = xgb.XGBClassifier(n_estimators=20, max_depth=4,learning_rate=0.1,subsample=0.7,colsample_bytree=0.7)
xgb_clf.fit(train_X, train_y)
pred_y = xgb_clf.predict(test_X)
prob_y = xgb_clf.predict_proba(test_X)[:,1]
prob_train_y = xgb_clf.predict_proba(train_X)[:,1]

# 模型评估
auc_score = roc_auc_score(test_y, pred_y)
auc_score_train = roc_auc_score(train_y, prob_train_y)
fpr, tpr,_ = roc_curve(test_y, prob_y)
fpr_tr, tpr_tr,_ = roc_curve(train_y, prob_train_y)

# 绘制roc曲线
plt.plot(fpr,tpr,label = 'test xgb auc=%0.3f'%auc_score) #绘制训练集ROC
plt.plot(fpr_tr,tpr_tr,label = 'train xgb auc=%0.3f'%auc_score_train) #绘制验证集ROC
plt.plot([0,1],[0,1],'k--')
plt.xlabel('False positive rate')
plt.ylabel('True positive rate')
plt.title('ROC Curve')
plt.legend(loc = 'best')
plt.show()
print(confusion_matrix(pred_y,test_y))
print((pred_y!=test_y).sum()/float(test_y.shape[0]))
print(classification_report(test_y,pred_y,  target_names=['Yes','No']))
总结
- 经过特征筛选后的模型没有得到加强
- 训练集和测试集的auc值变动较大,泛化能力较弱,需要对数据进行K折验证。


