使用Python模拟社会财富分配问题,得出了几个有趣的结论
本文通过简化了社会财富分配的过程,使用Python进行模拟计算,得出了几个有趣的结论。
文章目录
-
- 1.财富分配模型
- 2.允许借贷会如何呢?
- 3.努力的人生会更好吗?
- 小结
本文的灵感来源于城市数据团发布的一篇文章:该如何面对这个残酷的世界?
在这篇文章中,把社会财富分配问题简化成一个零和游戏,游戏基础规则如下:
房间里有100个人,每人都有100元钱,他们在玩一个游戏。每轮游戏中,每个人都要拿出一元钱随机给另一个人,最后这100个人的财富分布是怎样的?
结果更符合均匀分布、正态分布还是幂律(power law)分布?
接下来我们通过参考蒙特卡罗模拟算法的思想,使用Python对这个游戏的过程进行模拟,得出结论。
如果还不了解蒙特卡罗模拟算法的,可以参考我的上一篇文章:如何通过Python实现蒙特卡罗模拟算法
1.财富分配模型
模型假设
- 每个人初始基金100元;
- 从18岁到65岁,每天玩一次,简化运算按照一共玩17000轮;
- 每天拿出一元钱,并且随机分配给另一个人;
- 当某人的财富值降到0元时,他在该轮无需拿出1元钱给别人,但仍然有机会得到别人给出的钱。
Python模拟
有了以上的模型假设,我们就可以开始使用Python进行模拟游戏。
首先需要构造初始数据集,给100个玩家,每个人分配初始资金100元:
# 构造初始数据集:100个玩家,每个人都有100元初始资金
players_num = 100
players = range(1, players_num+1)  # 玩家编号
df = pd.DataFrame({
    'player': players,
    'money': [100] * players_num
})
接着,模拟整个游戏过程,把每一轮的财富分配结果都保存下来:
result = []  # 存储每次分配结果
total_round = 17000  # 总共轮次

# 保存还未开始游戏时每个玩家的的财富
result.append([0] + df['money'].to_list())

for round in range(1, total_round+1):
    # 幸运鹅数量
    lucky_guys_num = len(df[df['money'] > 0])
    # 每个人的财富都减1(除非没钱了)
    df['money'] = df['money'].apply(lambda x: x-1 if x > 0 else 0)
    # 计算每个人增加的金额
    lucky_guys = np.random.choice(players, size=lucky_guys_num)  # 有多少个人-1,就抽取多少次
    lucky_guys_bonus = Counter(lucky_guys)  # 幸运鹅对应的奖励金额
    df['money'] = df.apply(lambda row: lucky_guys_bonus.get(row['player'], 0) + row['money'], axis=1)
    result.append([round] + df['money'].to_list())  # 轮次以及每个玩家的财富
    print(f'Round {round}')

# 所有财富分配的结果
result_df = pd.DataFrame(result, columns=["round"] + list(players))
模拟完成后,我们可以查看最后一轮的财富分布情况:
# 指定查看第几轮的分配结果
round = 17000
show_df = result_df[result_df['round'] == round][players].iloc[0]

# 按照财富从小到大排序
show_df.sort_values(ascending=True, inplace=True)
show_df.reset_index(drop=True, inplace=True)

# 财富分配情况
plt.figure(figsize=(20, 10))
plt.grid()
plt.bar(show_df.index, show_df.values)
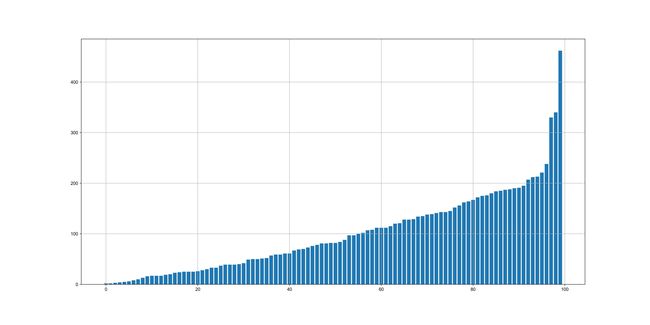
可以看到,即使在最公平的规则下,最终依然呈现出了贫富悬殊的局面:
同时,我们把整个变化过程也动态展示出来:
为了对贫富悬殊的程度进行量化,我们采用了基尼系数进行衡量。
基尼系数的Python实现,参考:基尼系数如何计算?
# 基尼系数计算的函数
def gini_coef(wealths):
    cum_wealths = np.cumsum(sorted(np.append(wealths, 0)))
    sum_wealths = cum_wealths[-1]
    xarray = np.array(range(0, len(cum_wealths))) / np.float(len(cum_wealths)-1)
    yarray = cum_wealths / sum_wealths
    B = np.trapz(yarray, x=xarray)
    A = 0.5 - B
    return A / (A+B)
有了这个计算方法,我们就可以计算每一轮游戏分配结束后的基尼系数:
# 计算每一轮结束后的基尼系数
gini_list = [gini_coef(item[list(players)]) for i, item in result_df.iterrows()]

# 基尼系数的变化曲线
fig = plt.figure(figsize=(10, 6))
plt.plot(gini_list)

plt.annotate(
    "%.2f" % gini_list[-1],
    xy=(len(gini_list)+1, gini_list[-1]),
    xytext=(16500, 0.4),
    arrowprops=dict(facecolor='black', arrowstyle='->')
)
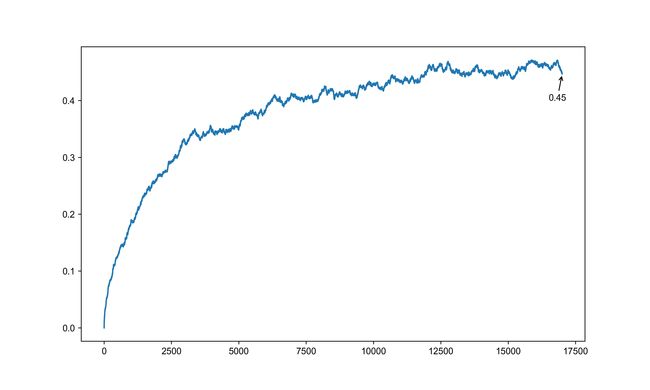
可以看出,基尼系数在前4000轮游戏中是变化最为剧烈的,后面才逐步平缓下来,当游戏结束时,基尼系数已经高达0.45,而0.45已经是属于收入差距较大的了。

2.允许借贷会如何呢?
模型假设
在第二个模型中,我们假设允许玩家借贷,意味着当玩家资产为负数时,仍然可以参与游戏,这与现实更为接近。
玩家从18岁开始,在经过17年后为35岁,这个期间共进行游戏6200次左右,则此刻查看财富情况,将财富值为负的标记成“破产”,研究该类玩家在今后的游戏中能否成功“逆袭”(财富值从负到正为逆袭)。
Python模拟
首先初始数据集和第一个模型一致,在此不再赘述,接下来模拟游戏过程:
result = []  # 存储每次分配结果
total_round = 17000  # 总共轮次

# 保存还未开始游戏时每个玩家的的财富
result.append([0] + df['money'].to_list())

for round in range(1, total_round+1):
    # 幸运鹅数量
    lucky_guys_num = players_num
    # 每个人的财富都减1
    df['money'] = df['money'].apply(lambda x: x-1)
    # 计算每个人增加的金额
    lucky_guys = np.random.choice(players, size=lucky_guys_num)  # 有多少个人-1,就抽取多少次
    lucky_guys_bonus = Counter(lucky_guys)  # 幸运鹅对应的奖励金额
    df['money'] = df.apply(lambda row: lucky_guys_bonus.get(row['player'], 0) + row['money'], axis=1)
    result.append([round] + df['money'].to_list())  # 轮次以及每个玩家的财富
    print(f'Round {round}')

# 所有财富分配的结果
result_df = pd.DataFrame(result, columns=["round"] + list(players))
同样经过模拟游戏,查看最终结果,这次我们把在第6200次游戏时财富为负数的玩家标记为破产,用红色展示:
# 6200次时财富为负数的玩家ID
temp_df = result_df[result_df['round'] == 6200].iloc[0]
loser_ids = list(temp_df[temp_df.values < 0].index)
print(f"6200次时财富为负数的玩家ID: {loser_ids}")

# 指定查看第几轮的分配结果
round = 17000

# 指定轮次结果
round_df = result_df[result_df['round'] == round][players].T.reset_index()
round_df.columns = ['player', 'money']
# 6200次游戏破产时的颜色设置为红色,其他人的颜色为蓝色
round_df['color'] = round_df['player'].apply(lambda x: 'red' if x in loser_ids else 'blue')

# 按照财富从小到大排序
round_df.sort_values(by='money', ascending=True, inplace=True)
round_df.reset_index(drop=True, inplace=True)

# 财富分配情况
plt.figure(figsize=(20, 10))
plt.grid()
plt.bar(round_df.index, round_df.money, color=round_df.color)
可以看到,在6200次游戏时,已经有11个玩家破产,而这11个玩家到游戏结束时,也仅仅只有1个玩家能够逆袭,剩下的10个玩家仍然处于破产状态中。
3.努力的人生会更好吗?
模型假设
在第二个模型的基础上,我们增加一条规则:有10个人加倍努力,从而获得了1%的竞争优势。
看看最终这10个人的情况。
Python模拟
同样初始化数据集之后,100个玩家赋予不同的权重:
# 假设更努力的10个人ID为
luckier_players = [1, 11, 21, 31, 41, 51, 61, 71, 81, 91]

luckier_player_p = 0.01 * 1.01  # 更努力的人的概率
others_player_p = (1 - luckier_player_p * 10) / 90  # 其他人的概率
# 最终的概率列表
player_p = [luckier_player_p if i in luckier_players else others_player_p for i in players]
同样进行17000轮游戏模拟,区别在于玩家获得财富的概率不同:
result = []  # 存储每次分配结果
total_round = 17000  # 总共轮次


# 保存还未开始游戏时每个玩家的的财富
result.append([0] + df['money'].to_list())

for round in range(1, total_round+1):
    # 幸运鹅数量
    lucky_guys_num = players_num
    # 每个人的财富都减1
    df['money'] = df['money'].apply(lambda x: x-1)
    # 计算每个人增加的金额
    lucky_guys = np.random.choice(players, size=lucky_guys_num, p=player_p)  # 有多少个人-1,就抽取多少次,不同用户赋予不同的权重
    lucky_guys_bonus = Counter(lucky_guys)  # 幸运鹅对应的奖励金额
    df['money'] = df.apply(lambda row: lucky_guys_bonus.get(row['player'], 0) + row['money'], axis=1)
    result.append([round] + df['money'].to_list())  # 轮次以及每个玩家的财富
    print(f'Round {round}')

# 所有财富分配的结果
result_df = pd.DataFrame(result, columns=["round"] + list(players))
查看所有玩家最后的财富排名,更努力的10个玩家同样用红色标出:
# 指定查看第几轮的分配结果
round = 17000

# 指定轮次结果
round_df = result_df[result_df['round'] == round][players].T.reset_index()
round_df.columns = ['player', 'money']
# 更努力的10个人的颜色设置为红色,其他人的颜色为蓝色
round_df['color'] = round_df['player'].apply(lambda x: 'red' if x in luckier_players else 'blue')

# 按照财富从小到大排序
round_df.sort_values(by='money', ascending=True, inplace=True)
round_df.reset_index(drop=True, inplace=True)

# 财富分配情况
plt.figure(figsize=(20, 10))
plt.grid()
plt.bar(round_df.index, round_df.money, color=round_df.color)
社会财富的总体分布形态没有什么变化,10个更加努力的玩家玩家中有6个进入了Top20:
再详细看一下这10个玩家的财富变化情况:
小结
通过以上3个游戏的模拟,我们得出了以下的几个结论:
- 最终的财富分布情况更接近于幂律分布(结论只是程序模拟,并非精确的数学求解),少数人掌握了大多数的财富;
- 35岁破产的人(对应着游戏中的6200次),到游戏结束时大多数仍然处于破产状态,只有极少数人能够逆袭;
- 只需比其他人努力一点点,最终大概率能够超过绝大多数人。
同样的,大家也可以对游戏规则进行一定的修改,进行更多的模拟,例如富二代的情况会如何(初始资金大于100)?或者提出其他问题进行验证亦可。


