在echaerts饼图(环形图)内部自定义文字
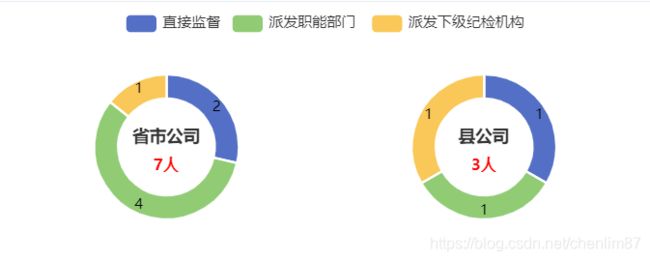
需求是利用echarts的饼图之环形图在内部自定义文字。如下图:

    const option = {
        title: [
          { // 第一个圆环标题
            text: '省市公司', // 主标题
            textStyle: { // 主标题样式
              color: '#333',
              fontWeight: 'bold',
              fontSize: 14
            },
            left: '24%', // 定位到适合的位置
            top: '50%', // 定位到适合的位置
            subtext: 'xxx', // 副标题
            subtextStyle: { // 副标题样式
              color: 'red',
              fontSize: 13,
              fontWeight: 'bold'
            },
            textAlign: 'center' // 主、副标题水平居中显示
          },
          {// 第二个圆环标题
            text: '县公司',
            textStyle: {
              color: '#333',
              fontWeight: 'bold',
              fontSize: 14
            },
            left: '74%',
            top: '50%',
            subtext: 'xxx',
            subtextStyle: {
              color: 'red',
              fontSize: 13,
              fontWeight: 'bold'
            },
            textAlign: 'center'
          }
        ],
        tooltip: {
          trigger: 'item'
        },
        legend: {
          top: '3%',
          left: 'center'
        },
        series: [
          { // 第一个圆环
            type: 'pie',
            radius: ['40%', '60%'],
            center: ['25%', '60%'],
            avoidLabelOverlap: false,
            itemStyle: {
              borderRadius: 10,
              borderColor: '#fff',
              borderWidth: 2
            },
            label: {
              show: true,
              position: 'inner', // 数据会显示在图形上,'center':会显示在圆环的内部
              color: '#000',
              formatter: '{c}' // 显示的数据
            },
            data: [2,4,1], //
          },
          { // 第二个圆环
            type: 'pie',
            radius: ['40%', '60%'],
            center: ['75%', '60%'],
            avoidLabelOverlap: false,
            itemStyle: {
              borderRadius: 10,
              borderColor: '#fff',
              borderWidth: 2
            },
            label: {
              show: true,
              position: 'inner',
              color: '#000',
              formatter: '{c}'
            },
            data: [1,1,1],
          }
        ]
      };
上面使用了title属性,通过偏移来定位到需要显示的位置,设置主、副标题样式,这样就达到了我们的要求。除了title属性,graphic属性也可以通过设置偏移达到上述效果。graphic还可以设置图片等其它样式。
---------------------2022.04.07更新-----------------------
使用graphic
上面使用了标题和副标题的形式来实现文字居中环形内部,今天用 graphic 实现一下。
在option添加配置graphic
graphic: [
			{
				type: 'text',// 类型,可以是文字、图片或其它类型
				id: 'text1',
				left: 'center',
				top: '46%',
				style: {
					text: '要显示的文字xxx',
					fill: '#919399', // 文字的颜色
					fontSize: 18
				}
			},
			{
				type: 'text',
				id: 'text2',
				left: 'center',
				top: '52%',
				style: {
					text: '要显示的文字xxx',
					fill: '#273849',
					fontSize: 33
				}
			}
		],