from sklearn.datasets import make_circles
from sklearn.cluster import KMeans, DBSCAN, SpectralClustering, Birch, MeanShift, AgglomerativeClustering
from sklearn.metrics import silhouette_score, silhouette_samples
from sklearn.decomposition import PCA
import matplotlib.pyplot as plt
import numpy as np
import pandas as pd
import time, os
import functools
import matplotlib.cm as cm
from torchvision.io.video import read_video
from torchvision.models.video import r3d_18, R3D_18_Weights
from torchvision.models.video import mvit_v1_b, MViT_V1_B_Weights
def cluster_test(model_name, model, X, clusters_list = [2,3,4,5,6,7]):
for n_clusters in clusters_list:
if hasattr(model, "n_clusters"):
model.set_params(n_clusters = n_clusters)
elif len(clusters_list) >= 2 and n_clusters == clusters_list[1]:
print("{} do not have parameter 'n_clusters', return automatically.".format(model_name))
return
fig, (ax1, ax2) = plt.subplots(1, 2)
fig.set_size_inches(18, 7)
ax1.set_xlim([-0.1, 1])
ax1.set_ylim([0, X.shape[0] + (n_clusters + 1) * 10])
clusterer, t = cluster_function(model_name, model, X)
cluster_labels = clusterer.labels_
silhouette_avg = silhouette_score(X, cluster_labels)
print("For n_clusters = ", n_clusters, " the average silhoutte_score is ", silhouette_avg)
sample_silhouette_values = silhouette_samples(X, cluster_labels)
y_lower = 10
for i in range(n_clusters):
ith_cluster_silhouette_values = sample_silhouette_values[cluster_labels == i]
ith_cluster_silhouette_values.sort()
size_cluster_i = ith_cluster_silhouette_values.shape[0]
y_upper = y_lower + size_cluster_i
color = cm.nipy_spectral(float(i) / n_clusters)
ax1.fill_betweenx(np.arange(y_lower, y_upper), ith_cluster_silhouette_values, facecolor = color, alpha = 0.7)
ax1.text(-0.05, y_lower + 0.5 * size_cluster_i, str(i))
y_lower = y_upper + 10
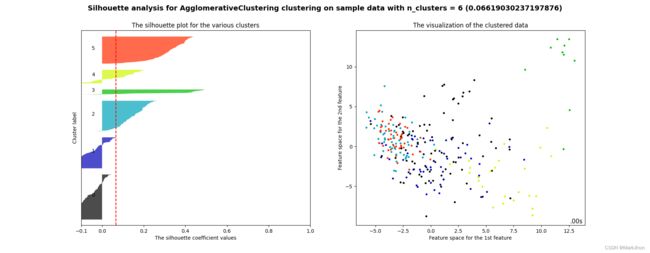
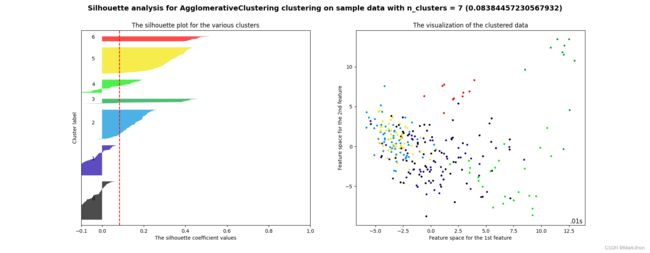
ax1.set_title("The silhouette plot for the various clusters")
ax1.set_xlabel("The silhouette coefficient values")
ax1.set_ylabel("Cluster label")
ax1.axvline(x = silhouette_avg, color = 'red', linestyle = "--")
ax1.set_yticks([])
ax1.set_xticks([-0.1, 0, 0.2, 0.4, 0.6, 0.8, 1])
colors = cm.nipy_spectral(cluster_labels.astype(float) / n_clusters)
ax2.scatter(pca_result[:,0], pca_result[:,1], marker = 'o', s = 8, c = colors)
if hasattr(clusterer, 'cluster_centers_'):
centers = clusterer.cluster_centers_
ax2.scatter(centers[:, 0], centers[:, 1], marker = 'x', c = 'red', alpha = 1, s = 200)
ax2.text(.99, .01, ('%.2fs' % (t)).lstrip('0'), transform=plt.gca().transAxes, size=12,horizontalalignment='right')
ax2.set_title("The visualization of the clustered data")
ax2.set_xlabel("Feature space for the 1st feature")
ax2.set_ylabel("Feature space for the 2nd feature")
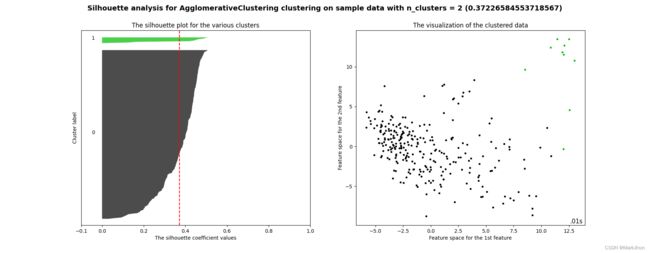
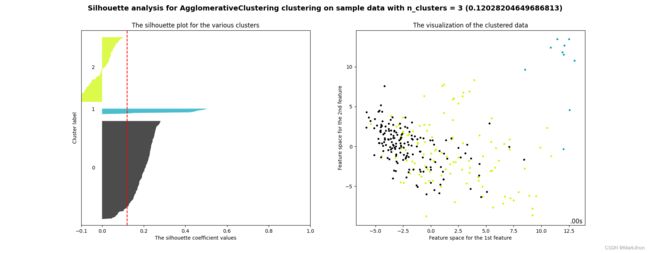
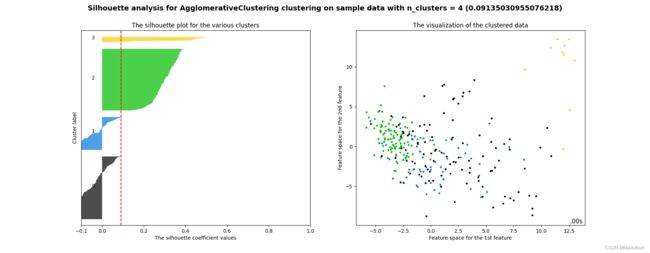
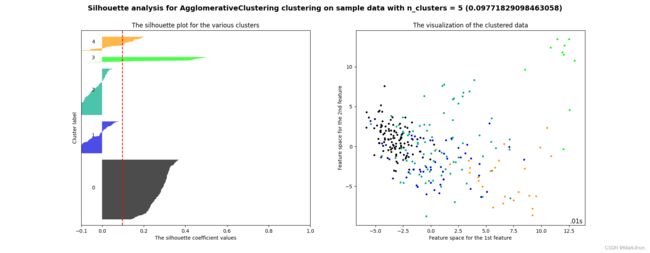
plt.suptitle("Silhouette analysis for {} clustering on sample data with n_clusters = {} ({})".format(model_name, n_clusters, silhouette_avg), fontsize = 14, fontweight="bold")
plt.show()
def time_cost(func):
@functools.wraps(func)
def wrapper(*args, **kwargs):
t0 = time.time()
func(*args, **kwargs)
t1 = time.time()
return func(*args, **kwargs), t1 - t0
return wrapper
@time_cost
def cluster_function(model_name, model, data):
model = model.fit(data)
return model
def load_data(file_dir):
assert file_dir != ''
x = []
for item in os.listdir(file_dir):
data = video_feature(os.path.join(file_dir, item))
x.append(np.array(data))
x = np.array(x)
print(x.shape)
#x = df.values
pca = PCA(n_components=6)
pca_result = pca.fit_transform(x)
return x, pca_result
def video_feature(file_path):
vid, _, _ = read_video(file_path, output_format="TCHW")
vid = vid[:16]
# Step 1: Initialize model with the best available weights
# weights = R3D_18_Weights.DEFAULT
# model = r3d_18(weights=weights)
weights = MViT_V1_B_Weights.DEFAULT
model = mvit_v1_b(weights)
model.eval()
# Step 2: Initialize the inference transforms
preprocess = weights.transforms()
# Step 3: Apply inference preprocessing transforms
batch = preprocess(vid).unsqueeze(0)
prediction = model(batch).squeeze(0)
prediction = prediction.cpu().detach().numpy()
# print(prediction.shape)
return prediction
# Step 4: Use the model and print the predicted category
prediction = model(batch).squeeze(0).softmax(0)
label = prediction.argmax().item()
score = prediction[label].item()
category_name = weights.meta["categories"][label]
print(f"{category_name}: {100 * score}%")
if __name__ == "__main__":
path = r"/home/markjhon/Common/Dataset/Infant/Left_hand"
# 加载数据
x, pca_result = load_data(path)
cluster_test("AgglomerativeClustering", AgglomerativeClustering(), x)