opencv图像处理之直方图
文章目录
-
-
- 0.什么是直方图
- 1.整幅图像的直方图
- 2.部分图像的直方图(使用mask)
- 3.直方图均衡化
- 4.2D直方图
- 5.直方图反向投影
-
0.什么是直方图
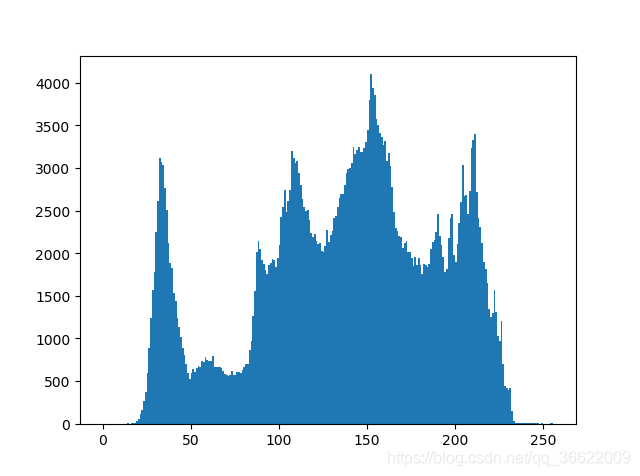
通过直方图你可以对整幅图像的灰度分布有一个整体的了解。直方图的x 轴是灰度值(0 到255),y 轴是图片中具有同一个灰度值的点的数目。
统计直方图的几个重要参数:
BINS:
- 直方图显示了每个灰度值对应的像素数。如果像素值为0到255,你就需要256 个数来显示上面的直方图。但是,如果你不需要知道每一个像素值的像素点数目的,而只希望知道两个像素值之间的像素点数目怎么办呢?举例来说,我们想知道像素值在0 到15 之间的像素点的数目,接着是16 到31,…,240 到255。我们只需要16 个值来绘制直方图。
- 那到底怎么做呢?你只需要把原来的256 个值等分成16 小组,取每组的总和。而这里的每一个小组就被成为BIN。第一个例子中有256 个BIN,第二个例子中有16 个BIN。在OpenCV 的文档中用
histSize表示BINS。
DIMS:
- 表示我们收集数据的参数数目。在本例中,我们对收集到的数据只考虑一件事:灰度值。所以这里就是1。
RANGE:
- 就是要统计的灰度值范围,一般来说为[0,256],也就是说所有的灰度值。
1.整幅图像的直方图
代码速记:
- plt.hist()
- cv2.calcHist()
- np.histogram()
- np.bincount()
参数解释:
plt.hist(raw_gray.ravel(),256,[0,256])#1:原图像展成一维数组。 2:bins。3.range
cv2.calcHist([raw_color],[i],None,[256],[0,256])#1:原图像。2:图像通道索引。3:mask。4:bins。5:range
np.histogram(raw_gray.ravel(), 256, [0, 256])#1:原图像展成一维数组。 2:bins。3.range
np.bincount(raw_gray.ravel(), minlength=256)#1:原图像展成一维数组。 2:bins的最小值
实战:
def accu_paint(self):
    raw_gray=cv2.imread(self.infile,0)
    raw_color=cv2.imread(self.infile)

    #【1】plot统计单通道直方图,用plot绘制
    plt.hist(raw_gray.ravel(),256,[0,256])
    plt.show()
    #【2】cv统计三通道直方图,用plot绘制
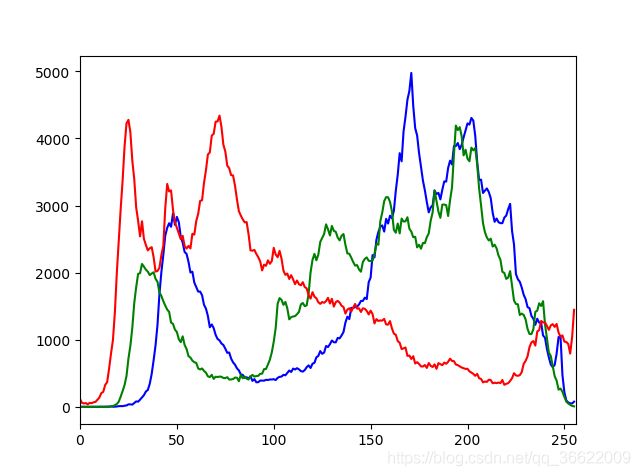
    color=('b','g','r')
    for i,col in enumerate(color):
        histr=cv2.calcHist([raw_color],[i],None,[256],[0,256])
        plt.plot(histr,color=col)
        plt.xlim([0,256])
    plt.show()
    #【3】numpy方法统计直方图,用plot绘制
    np_hist1, bins = np.histogram(raw_gray.ravel(), 256, [0, 256])  # cv函数比此函数快40倍
    # img.ravel()把图像转为一维数组
    np_hist2 = np.bincount(raw_gray.ravel(), minlength=256)  # 比histogram快十倍
    titles=['histogram','bincount']
    hists=[np_hist1,np_hist2]
    for i in range(2):
        plt.subplot(1,2,i+1),plt.plot(hists[i])
        plt.title(titles[i])
    plt.show()
plot统计单通道直方图,用plot绘制:

cv统计三通道直方图,用plot绘制:

numpy方法统计直方图,用plot绘制:

2.部分图像的直方图(使用mask)
代码速记:
- mask=np.zero()
- mask[:,:]=255
- cv2.calcHist(,mask,)
实战:
def mask_hist(self):
    raw_gray=cv2.imread(self.infile,0)
    mask=np.zeros(raw_gray.shape[:2],np.uint8)#mask为全黑的图像
    mask[100:500,100:600]=255#mask的该区域变白
    masked_img=cv2.bitwise_and(raw_gray,raw_gray,mask=mask)
    hist_full=cv2.calcHist([raw_gray],[0],None,[256],[0,256])
    hist_mask=cv2.calcHist([raw_gray],[0],mask,[256],[0,256])
    titles = ['raw_gray', 'mask','masked_img']
    imgs = [raw_gray, mask,masked_img]
    for i in range(3):
        plt.subplot(2, 2, i + 1), plt.imshow(imgs[i],'gray')
        plt.title(titles[i])
        plt.xticks([]), plt.yticks([])
    plt.subplot(2,2,4),plt.plot(hist_full),plt.plot(hist_mask)
    plt.xlim([0,256])
    plt.show()
3.直方图均衡化
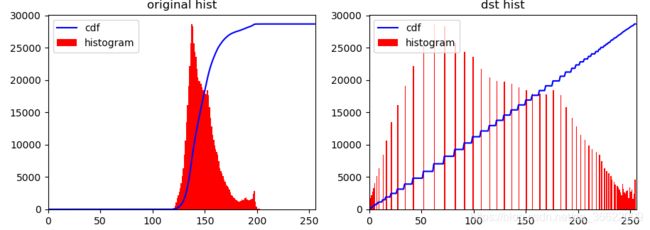
一副高质量的图像的像素值分布应该很广泛。所以你应该把它的直方图做一个横向拉伸,这就是直方图均衡化要做的事情。
(1)Numpy方法
代码速记:
- np.histogram()
- hist1.cumsum()
- np.ma.masked_equal()
- np.ma.filled()
- plt.hist()
实战:
def np_equalize(self):
    img = cv2.imread('../images/wiki.jpg', 0)
    #【1】计算原始图像的直方图及累积分布图
    hist1, bins = np.histogram(img.flatten(), 256, [0, 256])# 直方图
    cdf1 = hist1.cumsum()
    cdf_normalized1 = cdf1 * hist1.max() / cdf1.max()# 计算累积分布图
    #【2】对原始图像进行均衡化
    # 构建Numpy 掩模数组,cdf 为原数组,当数组元素为0 时,掩盖(计算时被忽略)。
    cdf_m = np.ma.masked_equal(cdf1, 0)
    cdf_m = (cdf_m - cdf_m.min()) * 255 / (cdf_m.max() - cdf_m.min())
    # 对被掩盖的元素赋值,这里赋值为0
    cdf = np.ma.filled(cdf_m, 0).astype('uint8')
    img2 = cdf[img]#得到均衡化后的图像
    #【3】计算均衡化后图像的直方图及累积分布图
    hist2, bins = np.histogram(img2.flatten(), 256, [0, 256])
    cdf2 = hist2.cumsum()# 计算累积分布图
    cdf_normalized2 = cdf2 * hist2.max() / cdf2.max()
    #【4】展示:用plot
    plt.subplot(121),plt.title('original hist'),plt.hist(img.flatten(), 256, [0, 256], color='r')
    plt.plot(cdf_normalized1, color='b'),plt.xlim([0, 256]),plt.legend(('cdf', 'histogram'), loc='upper left')
    plt.subplot(122),plt.title('dst hist'),plt.hist(img2.flatten(), 256, [0, 256], color='r')
    plt.plot(cdf_normalized2, color='b'),plt.xlim([0, 256]),plt.legend(('cdf', 'histogram'), loc='upper left')
    plt.show()
代码速记:
- cv2.equalizeHist()
实战:
def cv_equalize(self):
    img = cv2.imread('../images/wiki.jpg', 0)
    equ = cv2.equalizeHist(img)#均衡化
    res = np.hstack((img, equ))  # 拼接图像
    #展示
    plt.imshow(res, 'gray')
    plt.xticks([]), plt.yticks([])
    plt.show()
(3)CLAHE 有限对比适应性直方图均衡化
- 我们在上边做的直方图均衡化会改变整个图像的对比度,但是在很多情况下,这样做的效果并不好。新图像可能因为太亮而丢失很多信息。造成这种结果的根本原因在于图像的直方图并不是集中在某一个区域。为了解决这个问题,我们需要使用
自适应的直方图均衡化。 - 这种情况下,整幅图像会被分成很多小块,这些小块被称为“tiles”(在OpenCV 中tiles 的大小默认是8x8),然后再对每一个小块分别进行直方图均衡化(跟前面类似)。所以在每一个的区域中,直方图会集中在某一个小的区域中(除非有噪声干扰)。如果有噪声的话,噪声会被放大。为了避免这种情况的出现要使用对比度限制。对于每个小块来说,如果直方图中的bin 超过对比度的上限的话,就把其中的像素点均匀分散到其他bins 中,然后再进行直方图均衡化。最后,为了去除每一个小块之间“人造的”(由于算法造成)边界,再使用双线性差值,对小块进行缝合。
代码速记:
- cv2.createCLAHE()
- clahe.apply()
实战:
def clahe(self):
    img = cv2.imread('../images/tsukuba_l.png', 0)
    # 普通均衡化
    equ = cv2.equalizeHist(img)
    #自适应均衡化
    clahe = cv2.createCLAHE(clipLimit=2.0, tileGridSize=(8, 8))# create a CLAHE object (Arguments are optional).
    cl1 = clahe.apply(img)
    #展示
    titles = ['raw', 'equ','clahe']
    imgs = [img, equ,cl1]
    for i in range(3):
        plt.subplot(1, 3, i + 1), plt.imshow(imgs[i],'gray')
        plt.title(titles[i])
        plt.xticks([]), plt.yticks([])
    plt.show()
4.2D直方图
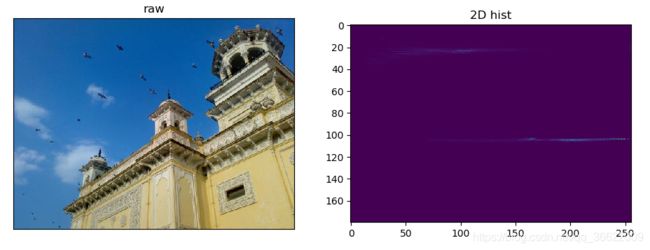
在前面的部分我们介绍了如何绘制一维直方图,之所以称为一维,是因为我们只考虑了图像的一个特征:灰度值。但是在2D 直方图中我们就要考虑两个图像特征。对于彩色图像的直方图通常情况下我们需要考虑每个的颜色(Hue)和饱和度(Saturation)。根据这两个特征绘制2D 直方图。
代码速记:
- cv2.calcHist()
- np.histogram2d()
- plt.imshow()
参数解释:
 #cv方法:
 hist = cv2.calcHist([hsv], [0, 1], None, [180, 256], [0, 180, 0, 256])
- channels=[0,1] 因为我们需要同时处理H 和S 两个通道。
- bins=[180,256] H 通道为180,S 通道为256。
- range=[0,180,0,256] H 的取值范围在0 到180,S 的取值范围在0 到256。
#Numpy方法:
hist, xbins, ybins = np.histogram2d(h.ravel(), s.ravel(), [180, 256], [[0, 180], [0, 256]])
第一个参数是H 通道,第二个参数是S 通道,第三个参数是bins 的数目,第四个参数是数值范围。
#绘制 2D直方图:
plt.imshow(hist,interpolation = 'nearest')
- 我们得到结果是一个180x256 的两维数组。所以我们可以使用函数cv2.imshow() 来显示它。但是这是一个灰度图,除非我们知道不同颜色H 通道的值,否则我们根本就不知道那到底代表什么颜色。
- 还可以使用函数matplotlib.pyplot.imshow()来绘制2D 直方图,再搭配上不同的颜色图(color_map)。这样我们会对每个点所代表的数值大小有一个更直观的认识。但是跟前面的问题一样,你还是不知道那个数代表的颜色到底是什么。
实战:
def two_d_hist(self):
     img = cv2.imread('../images/home.jpg')
     copy=img.copy()
     #【1】把图像转为HSV模式
     hsv = cv2.cvtColor(img, cv2.COLOR_BGR2HSV)
     #【2】计算二维直方图
     #cv方法:
     hist = cv2.calcHist([hsv], [0, 1], None, [180, 256], [0, 180, 0, 256])
     # Numpy方法:
     h, s, v = cv2.split(hsv)
     hist, xbins, ybins = np.histogram2d(h.ravel(), s.ravel(), [180, 256], [[0, 180], [0, 256]])
     #【3】绘制2D直方图
     plt.subplot(121), plt.imshow(cv2.cvtColor(copy,cv2.COLOR_BGR2RGB))
     plt.title('raw'),plt.xticks([]), plt.yticks([])
     plt.subplot(122),plt.imshow(hist,interpolation = 'nearest'),plt.title('2D hist')
     plt.show()

X 轴显示S 值,Y 轴显示H 值。在H=100,S=100 附近有比较高的值。这部分与天的蓝色相对应。同样另一个峰值在H=25 和S=100 附近。这一宫殿的黄色相对应。
5.直方图反向投影
- 直方图反向投影是由Michael J. Swain 和Dana H. Ballard 在他们的文章“Indexing via color histograms”中提出。它可以用来做图像分割,或者在图像中找寻我们感兴趣的部分。简单来说,它会输出与输入图像(待搜索)同样大小的图像,其中的每一个像素值代表了输入图像上对应点属于目标对象的概率。用更简单的话来解释,输出图像中像素值越高(越白)的点就越可能代表我们要搜索的目标(在输入图像所在的位置)。
- 我们应该怎样来实现这个算法呢?首先我们要为一张包含我们要查找目标的图像创建直方图(在我们的示例中,我们要查找的是草地,其他的都不要)。我们要查找的对象要尽量占满这张图像(换句话说,这张图像上最好是有且仅有我们要查找的对象)。最好使用颜色直方图,因为一个物体的颜色要比它的灰度能更好的被用来进行图像分割与对象识别。接着我们再把这个颜色直方图投影到输入图像中寻找我们的目标,也就是找到输入图像中的每一个像素点的像素值在直方图中对应的概率,这样我们就得到一个概率图像,最后设置适当的阈值对概率图像进行二值化。
(1)Numpy方法
def numpy_back_project(self):
    #【1】roi是要查找的目标区域
    roi = cv2.imread('../images/grass.jpg')
    hsv = cv2.cvtColor(roi, cv2.COLOR_BGR2HSV)
    #【2】target是我们用来查找的图像:在messi图像中查找草地
    target = cv2.imread('../images/messi.jpg')
    hsvt = cv2.cvtColor(target, cv2.COLOR_BGR2HSV)
    #【3】得到两幅图像的直方图
    M = cv2.calcHist([hsv], [0, 1], None, [180, 256], [0, 180, 0, 256])
    I = cv2.calcHist([hsvt], [0, 1], None, [180, 256], [0, 180, 0, 256])
    #【4】反向投影
    R=cv2.divide(M,I)#根据R 这个”调色板“创建一副新的图像,其中的每一个像素代表这个点就是目标的概率。
    h, s, v = cv2.split(hsvt)
    B = R[h.ravel(), s.ravel()]#h 为点(x,y)处的hue 值,s 为点(x,y)处的saturation 值。
    B = np.minimum(B, 1)#B (x,y) = min [B (x,y),1]。
    B = B.reshape(hsvt.shape[:2])
    disc = cv2.getStructuringElement(cv2.MORPH_ELLIPSE, (5, 5))
    B = cv2.filter2D(B, -1, disc)#使用一个圆盘算子做卷积,B = D x B,其中D 为卷积核
    B = np.uint8(B)
    cv2.normalize(B, B, 0, 255, cv2.NORM_MINMAX)#归一化处理
    #输出图像中灰度值最大的地方就是我们要查找的目标的位置
    #【5】对输出图像做二值化
    ret, thresh = cv2.threshold(B, 50, 255, 0)
    #展示
    plt.subplot(131), plt.imshow(cv2.cvtColor(roi,cv2.COLOR_BGR2RGB))
    plt.title('roi'),plt.xticks([]), plt.yticks([])
    plt.subplot(132), plt.imshow(cv2.cvtColor(target,cv2.COLOR_BGR2RGB))
    plt.title('target'),plt.xticks([]), plt.yticks([])
    plt.subplot(133), plt.imshow(thresh,'gray')
    plt.title('thresh'),plt.xticks([]), plt.yticks([])
    plt.show()
OpenCV 提供的函数cv2.calcBackProject() 可以用来做直方图反向投影。它的参数与函数cv2.calcHist 的参数基本相同。其中的一个参数是我们要查找目标的直方图。同样在使用目标的直方图做反向投影之前我们应该先对其做归一化处理。返回的结果是一个概率图像,我们再使用一个圆盘形卷积核对其做卷积操作,最后使用阈值进行二值化。
代码速记:
- cv2.calcHist()
- cv2.normalize()
- cv2.calcBackProject()
def cv_back_project(self):
    #【1】roi是要查找的目标区域
    roi = cv2.imread('../images/grass.jpg')
    hsv = cv2.cvtColor(roi, cv2.COLOR_BGR2HSV)
    #【2】target是我们用来查找的图像:在messi图像中查找草地
    target = cv2.imread('../images/messi.jpg')
    hsvt = cv2.cvtColor(target, cv2.COLOR_BGR2HSV)
    #【3】得到 roi的直方图
    roihist = cv2.calcHist([hsv], [0, 1], None, [180, 256], [0, 180, 0, 256])
    #【4】归一化直方图并进行反向投影
    # 归一化之后的直方图便于显示,归一化之后就成了0 到255 之间的数了。
    cv2.normalize(roihist, roihist, 0, 255, cv2.NORM_MINMAX)
    #输入参数为:原始图像,结果图像,映射到结果图像中的最小值,最大值,归一化类型
    # cv2.NORM_MINMAX 对数组的所有值进行转化,使它们线性映射到最小值和最大值之间

    dst = cv2.calcBackProject([hsvt], [0, 1], roihist, [0, 180, 0, 256], 1)

    #【5】用圆盘算子做卷积,把分散的点连在一起
    disc = cv2.getStructuringElement(cv2.MORPH_ELLIPSE, (5, 5))
    dst = cv2.filter2D(dst, -1, disc)
    #【6】对结果图像二值化
    ret, thresh = cv2.threshold(dst, 50, 255, 0)
    #【7】合并为三通道
    thresh = cv2.merge((thresh, thresh, thresh))
    res = cv2.bitwise_and(target, thresh)# 按位操作
    res = np.hstack((target, thresh, res))#拼接三幅图像
    # 展示
    plt.imshow(cv2.cvtColor(res, cv2.COLOR_BGR2RGB))
    plt.xticks([]), plt.yticks([]), plt.show()


