1.红加蓝
img = np.zeros([256, 256, 3], dtype=np.uint8)
 for i in range(256):
    for j in range(256):
       img[i, j] = (255 - i, 0, j)
在img[i, j]中,i意味着从上到下,j意味着从做到右。从左向右256个像素逐渐变红,从下往上256个像素逐渐变蓝:
2.绿加红
img[i, j] = (255 - i, 255 - j, 0)从左向右256个像素逐渐变红,从上往下256个像素逐渐变绿:
3.蓝加绿
img[i, j] = (0, i, j)从左向右256个像素逐渐变绿,从上往下256个像素逐渐变蓝:
4.plt绘制三视图
img = cv2.imread("./br.jpg")
img1 = cv2.imread("./gr.jpg")
img2 = cv2.imread("./bg.jpg")

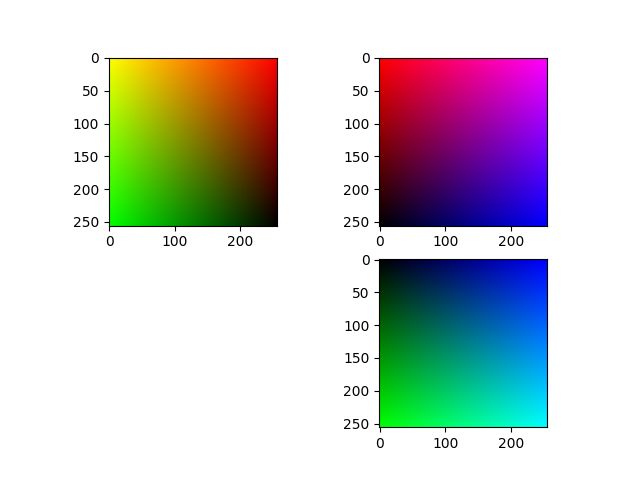
plt.subplot(2, 2, 1); plt.imshow(img1)
plt.subplot(2, 2, 2); plt.imshow(img)
plt.subplot(2, 2, 4); plt.imshow(img2)
在opencv中颜色通道是(蓝,绿,红);在plt中是(红,绿,蓝)。得到三视图:
5.综上重新绘制六面图形
img1 = np.zeros([256, 256, 3], dtype=np.uint8)
 img2 = np.zeros([256, 256, 3], dtype=np.uint8)
 img3 = np.zeros([256, 256, 3], dtype=np.uint8)
 img4 = np.zeros([256, 256, 3], dtype=np.uint8)
 img5 = np.zeros([256, 256, 3], dtype=np.uint8)
 img6 = np.zeros([256, 256, 3], dtype=np.uint8)
 for i in range(256):
    for j in range(256):
       # 红色向右,蓝色向上
       img1[i, j] = (255 - i, 0, j)
       # 蓝色向上,绿色向左
       img2[i, j] = (255 - i, 255 - j, 0)
       # 绿色向下,红色向右
       img3[i, j] = (0, i, j)
       # 蓝色走到了最边上,绿色向上,红色向右
       img4[i, j] = (255, 255 - i, j)
       # 红色走到了最边上,绿色向右,蓝色向上
       img5[i, j] = (255 - i, j, 255)
       # 绿色走到了最边上,红色向左,蓝色向上
       img6[i, j] = (255 - i, 255, 255 - j)

 plt.subplot(3, 4, 6)
 plt.imshow(img1)
 plt.subplot(3, 4, 5)
 plt.imshow(img2)
 plt.subplot(3, 4, 10)
 plt.imshow(img3)
 plt.subplot(3, 4, 2)
 plt.imshow(img4)
 plt.subplot(3, 4, 7)
 plt.imshow(img5)
 plt.subplot(3, 4, 8)
 plt.imshow(img6)