《机器学习在车险定价中的应用》实验报告
目录
一、实验题目
机器学习在车险定价中的应用
二、实验设置
1. 操作系统:
2. IDE:
3. python:
4. 库:
三、实验内容
实验前的猜想:
四、实验结果
1. 数据预处理及数据划分
独热编码处理结果(以地区为例)
2. 模型训练
3. 绘制初始决策树
4. 模型评价
5. 模型优化
绘制优化后的决策树
6. 修改样本、网格搜索参数进一步优化模型
五、实验分析
一、实验题目
机器学习在车险定价中的应用
二、实验设置
1. 操作系统:
Windows 11 Home
2. IDE:
PyCharm 2022.3.1 (Professional Edition)
3. python:
3.8.0
4. 库:
| numpy |
1.20.0 |
|
| matplotlib |
3.7.1 |
|
| pandas |
1.1.5 |
|
| scikit-learn |
0.24.2 |
conda create -n ML python==3.8 pandas scikit-learn numpy matplotlib三、实验内容
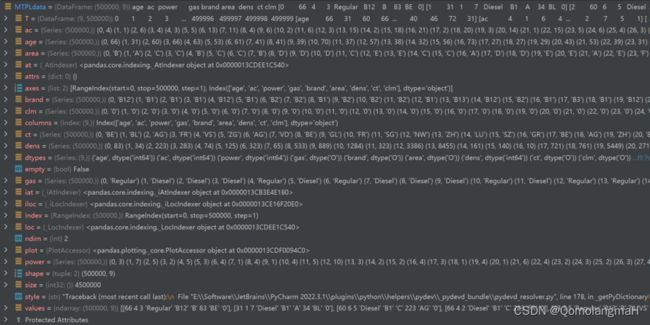
本次实验使用决策树模型进行建模,实现对车险 数据的分析,车险数据为如下MTPLdata.csv数据集:
该车险数据集包含了50万个样本,每个样本有8个特征和1个标签。其中,标签是一个二元变量,值为0或1,表示车主是否报告过车险索赔(clm,int64);特征包括车主的年龄(age,int64),车辆的年限(ac,int64)、功率(power,int64)、燃料类型(gas,object)、品牌(brand,object),车主所在地区(area,object)、居住地车辆密度(dens,int64)、以及汽车牌照类型(ct,object)。
实验前的猜想:
详见实验报告
四、实验结果
1. 数据预处理及数据划分
将数据读入并进行数据预处理,包括哑变量处理和划分训练集和测试集
MTPLdata = pd.read_csv('MTPLdata.csv')
# 哑变量处理-独热编码
# 将clm列的数据类型转换为字符串
MTPLdata['clm'] = MTPLdata['clm'].map(str)
# 选择包括第1、2、3、4、5、6、7、8列的数据作为特征输入
# ac、brand、age、gas、power
X_raw = MTPLdata.iloc[:, [0, 1, 2, 3, 4]]
# X_raw = MTPLdata.iloc[:, [0, 1, 2, 3, 4, 5, 6, 7]]
# 对X进行独热编码
X = pd.get_dummies(X_raw)
# 选择第9列作为标签y
y = MTPLdata.iloc[:, 8]

# 将数据划分为训练集和测试集,测试集占总数据的20%
X_train, X_test, y_train, y_test = train_test_split(X, y, stratify=y, test_size=0.2, random_state=1)
独热编码处理结果(以地区为例)
2. 模型训练
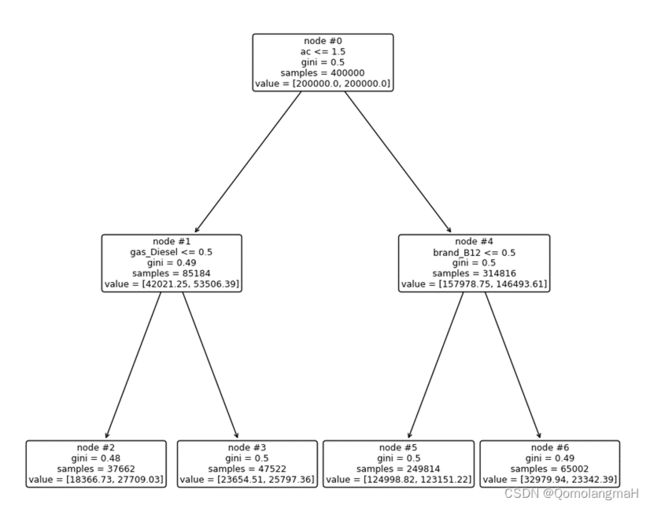
我们使用决策树分类器模型进行训练(设定树的最大深度为2,使用平衡的类权重,并默认使用基尼系数检验准确度)。
model = DecisionTreeClassifier(max_depth=2, class_weight='balanced', random_state=123)
model.fit(X_train, y_train)     # 数据拟合
model.score(X_test, y_test)     # 在测试集上评估模型
3. 绘制初始决策树
为了更好地解读决策树模型,调用plot_tree函数绘制决策树。
plt.figure(figsize=(11, 11))
plot_tree(model, feature_names=X.columns, node_ids=True, rounded=True, precision=2)
plt.show()
4. 模型评价
pred = model.predict(X_test)
table = pd.crosstab(y_test, pred, rownames=['Actual'], colnames=['Predicted'])
# table

# 计算模型的准确率、错误率、召回率、特异度和查准率
table = np.array(table)  # 将pandas DataFrame转换为numpy array
Accuracy = (table[0, 0] + table[1, 1]) / np.sum(table)      # 准确率
Error_rate = 1 - Accuracy  # 错误率
Sensitivity = table[1, 1] / (table[1, 0] + table[1, 1])     # 召回率
Specificity = table[0, 0] / (table[0, 0] + table[0, 1])     # 特异度
Recall = table[1, 1] / (table[0, 1] + table[1, 1])          # 查准率
5. 模型优化
为了寻找更优的模型,我们使用cost_complexity_pruning_path函数计算不同的ccp_alpha对应的决策树的叶子节点总不纯度,并绘制ccp_alpha与总不纯度之间的关系图。
model = DecisionTreeClassifier(class_weight='balanced', random_state=123)
path = model.cost_complexity_pruning_path(X_train, y_train)
plt.plot(path.ccp_alphas, path.impurities, marker='o', drawstyle='steps-post')
plt.xlabel('alpha (cost-complexity parameter)')
plt.ylabel('Total Leaf Impurities')
plt.title('Total Leaf Impurities vs alpha for Training Set')
plt.show()
1w样本 50w样本
接着,我们通过交叉验证选择最优的ccp_alpha,并使用最优的ccp_alpha重新训练模型。
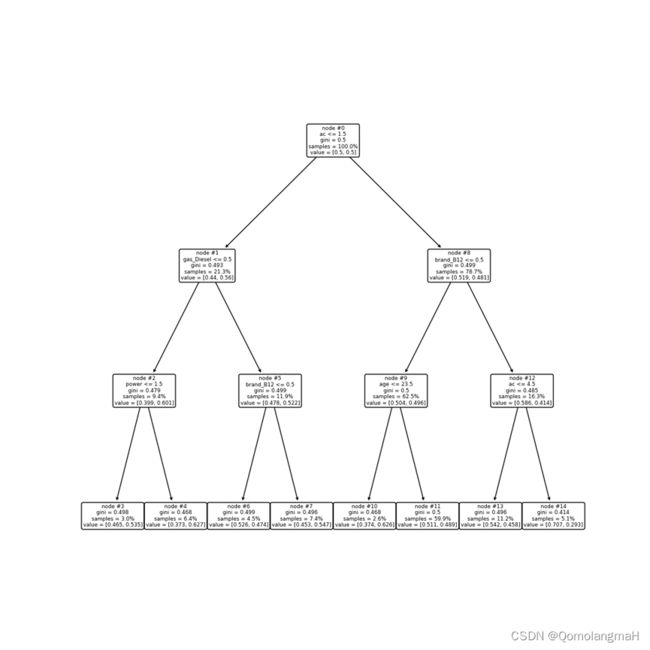
绘制优化后的决策树
rangeccpalpha = np.linspace(0.000001, 0.0001, 10, endpoint=True)
param_grid = {
    'max_depth':  np.arange(3, 7, 1),
    # 'ccp_alpha': rangeccpalpha,
    'min_samples_leaf': np.arange(1, 5, 1)
}
kfold = StratifiedKFold(n_splits=10, shuffle=True, random_state=1)
model = GridSearchCV(DecisionTreeClassifier(class_weight='balanced', random_state=123),
                     param_grid, cv=kfold)
model.fit(X_train, y_train)
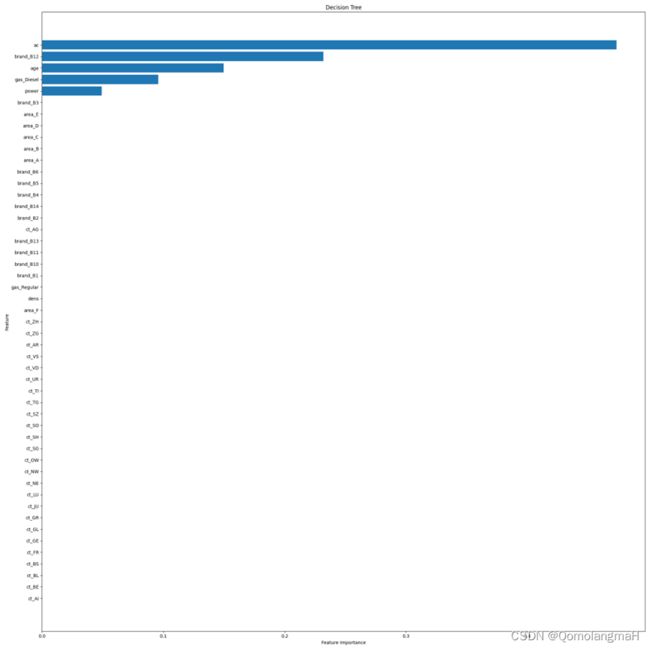
此外,还计算了各个特征的重要性,并绘制了特征重要性图。
plt.figure(figsize=(20, 20))
sorted_index = model.feature_importances_.argsort()
plt.barh(range(X_train.shape[1]), model.feature_importances_[sorted_index])
plt.yticks(np.arange(X_train.shape[1]), X_train.columns[sorted_index])
plt.xlabel('Feature Importance')
plt.ylabel('Feature')
plt.title('Decision Tree')
plt.tight_layout()
plt.show()
6. 修改样本、网格搜索参数进一步优化模型
详见实验报告
五、实验分析
请下载本实验对应的代码及实验报告资源(其中实验分析部分共2页、1162字)


