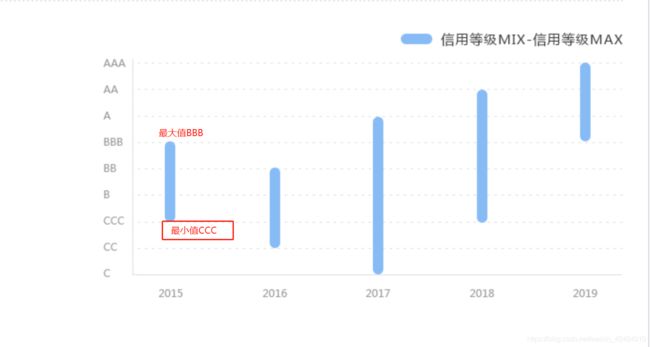
echarts显示条形图例的综合的最大值最小值
<style>
       #myChart{
           width:800px;
           height:500px;
       }
    style>
<div id="myChart">div>
<script src="jquery.min.js"></script>
    <script src="https://echarts.baidu.com/dist/echarts.min.js"></script>
    <script>

    var myChart = echarts.init(document.getElementById('myChart'));

    option= {
        tooltip: {
            trigger: 'axis',
            axisPointer: {            // 坐标轴指示器,坐标轴触发有效
                type: 'line'        // 默认为直线,可选为:'line' | 'shadow'
            },

            // --设置鼠标移入图表显示的提示
            formatter: function (params) {
                // 获取在series中设置的data--鼠标移入图表显示的提示
                console.log('666',params)
                var tar;
                if (params[1].value != '-') {
                    tar = params[1]; //第二个series中的值
                }
                else {
                    tar = params[0]; //第一个series中的值
                }
                var tar1 = params[0];
                var tar2 = params[1];

                // tar2.value+tar1.value 即最大值
                return tar.name + '
' + tar.seriesName + ' : ' +tar1.value
                    +'-'+(tar2.value+tar1.value);
            }
        },
        legend: {
            x: "right",
            y: "top",
            padding: [0, 25, 0, 0],
            data: ['信用等级MIN-信用等级MAX'],
        },
        grid: {
            left: '3%',
            right: '4%',
            bottom: '3%',
            containLabel: true
        },
        xAxis: {
            axisTick: {
                show: false
            },
            axisLine: {
                lineStyle: {
                    color: '#b0b0b0'
                }
            },
            type: 'category', //x轴设为类目轴
            splitLine: {show: false},
            data: [2015, 2016, 2017, 2018, 2019]
        },
        yAxis: {
            // y轴刻度从0到8 个数为8个
            min: 0,
            max: 8,
            splitNumber:8,
            axisTick: {
                show: false
            },
            axisLine: {
                lineStyle: {
                    color: '#b0b0b0'
                }
            },
            type:'value',
            splitLine: {
                show: true,
                lineStyle: {
                    type: 'dashed',
                    color: ['#aaa', '#ddd']
                }
            },
            axisLabel: {
                show: true,
                interval: 'auto',
                formatter:function(value,index){
                    // 将y轴上的刻度改为类目轴 即以'AAA'显示
                    var res =[]
                    if(index==0){
                        res.push('C')
                    }else if(index == 1){
                        res.push('CC')
                    }else if(index == 2){
                        res.push('CCC')
                    }else if(index == 3){
                        res.push('B')
                    }else if(index == 4){
                        res.push('BB')
                    }else if(index == 5){
                        res.push('BBB')
                    }else if(index == 6){
                        res.push('A')
                    }else if(index == 7){
                        res.push('AA')
                    }else if(index == 8){
                        res.push('AAA')
                    }
                    console.log(res)
                    return res;
                }
            },
        },
        series: [
            {
                name: '信用等级MIN',
                type: 'bar',
                stack: '总量',
                itemStyle: {
                    normal: {
                        barBorderColor: 'rgba(0,0,0,0)',
                        color: 'rgba(0,0,0,0)'
                    },
                    emphasis: {
                        barBorderColor: 'rgba(0,0,0,0)',
                        color: 'rgba(0,0,0,0)'
                    }
                },
                // 隐藏辅助
                // 最小值
                data: [1, 2, 5, 3, 1],
            },
                {
                    name: '信用等级MIN-信用等级MAX',
                    type: 'bar',
                    stack: '总量',
                    barWidth: 12,
                    itemStyle: {
                        emphasis: {
                            // 圆角边框
                            barBorderRadius: 7
                        },
                        normal: {
                            // 圆角边框
                            barBorderRadius: 7,
                            color: '#87bbf5'
                        }
                    },
                    label: {
                        normal: {
                            show: false,
                            position: 'top'
                        }
                    },
                    // 条形图最高点 = 最小值 + 最大值
                   // 图表显示的最大值 = 获取到的最大值 - 最小值(7-1=6;8-2) ---这样在图表中显示即正确
                   //  data: [7, 8, 7, 4, 8]
                    data:[6,6,2,1,7]
                },

            ]
    }

    myChart.setOption(option);
    </script>
