数学建模:回归分析
文章首发于我的个人博客:欢迎大佬们来逛逛
数学建模:回归分析
文章目录
- 数学建模:回归分析
- 回归分析
-
- 多元线性回归
-
- 案例
- 多项式回归
-
- 一元多项式回归
- 多元二项式回归
- 非线性回归
- 逐步回归
回归分析
多元线性回归
案例
- 首先进行回归分析
clc;clear;
x=[143 145 146 147 149 150 153 154 155 156 157 158 159 160 162 164]';
X=[ones(16,1) x];
Y=[88 85 88 91 92 93 93 95 96 98 97 96 98 99 100 102]';

%% 回归分析
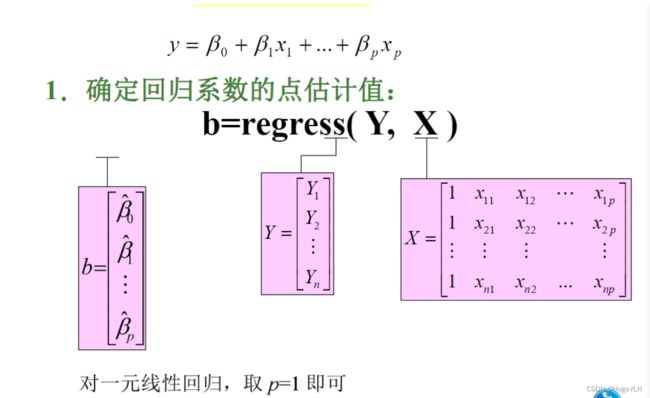
[b,bint,r,rint,states] = regress(Y,X);
- p < 0.05 p<0.05 p<0.05 回归模型成立
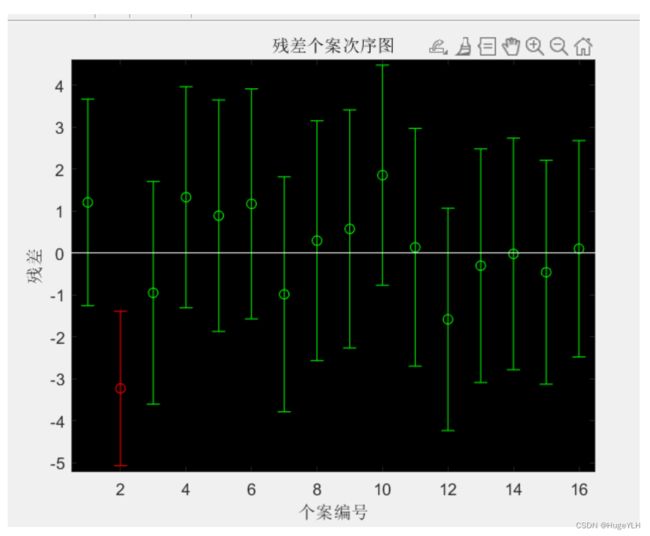
- 建立残差图
rcoplot(r,rint);
多项式回归
一元多项式回归
案例
- 直接做二次多项式回归
%% 一元多项式回归
clc;clear;

x=1/30:1/30:14/30;
y=[11.86 15.67 20.60 26.69 33.71 41.93 51.13 61.49 72.90 85.44 99.08 113.77 129.54 146.48];
m=2;
%% 回归分析
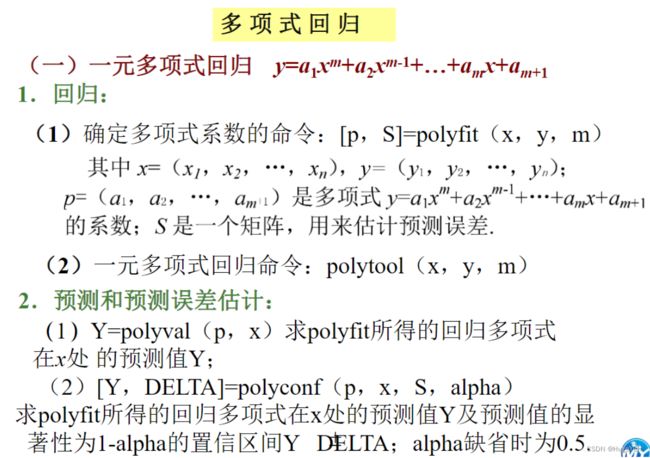
[p,S] = polyfit(x,y,m);
% p(1)*x^2 + p(2)*x^1 + p(3)

%% 绘图
polytool(x,y,m);

%% 预测在某位置的值
polyval(p,0.1);

%% 预测某位置的值并且返回置信区间
[Y,Delta] = polyconf(p,x,S,0.5);
- 化为多元线性回归
x=1/30:1/30:14/30;
y=[11.86 15.67 20.60 26.69 33.71 41.93 51.13 61.49 72.90 85.44 99.08 113.77 129.54 146.48];
T=[ones(14,1) x' (x.^2)'];
[b,bint,r,rint,stats]=regress(y',T);
b,stats
多元二项式回归
案例
- 直接多元二项式回归
	x1=[1000 600 1200 500 300 400 1300 1100 1300 300];
x2=[5 7 6 6 8 7 5 4 3 9];
y=[100 75 80 70 50 65 90 100 110 60]';
x=[x1' x2'];
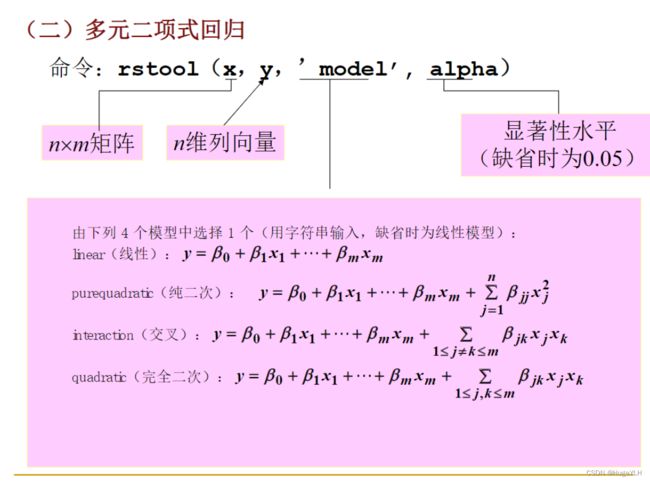
rstool(x,y,'purequadratic')
- 化为多元线性回归
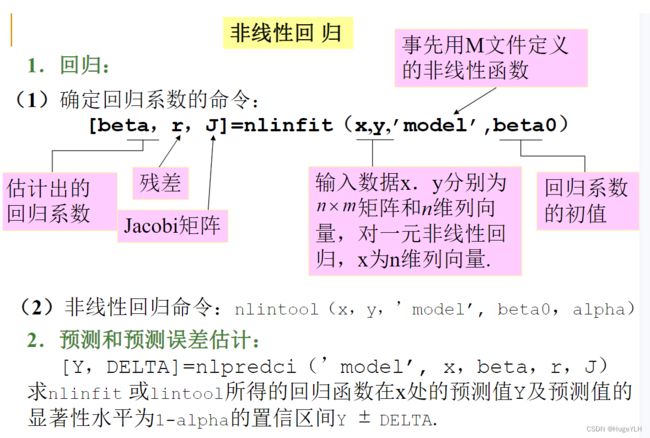
非线性回归
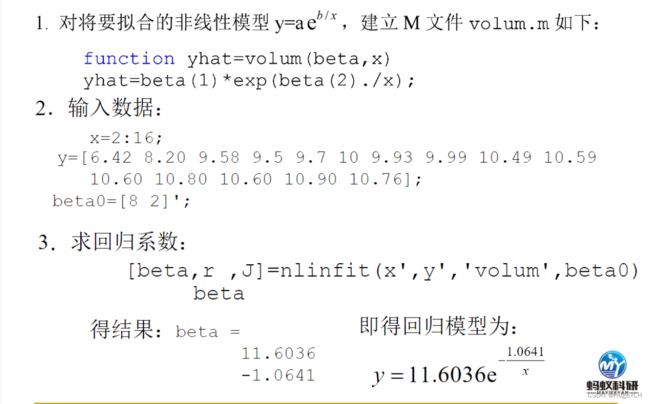
clc;clear;

x = 2:16;
y = [2,3,4,5,7,4,3,6,8,9,4,1,0,5,4];
beta0 = [8 2]';
%% 非线性回归分析
[beta,r,J] = nlinfit(x',y','Volum',beta0);

%% 预测与绘图
[YY,delta] = nlpredci('Volum',x',beta,r,J);
plot(x,y,'k+',x,YY,'r');

------
%% 拟合模型: y = a*e^(b/x)
function y = Volum(beta,x)
    y = beta(1)*exp(beta(2)./x);
end
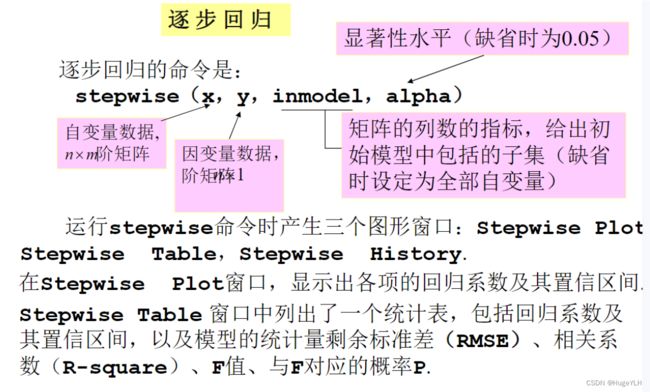
逐步回归
25 回归分析算法基本原理及编程实现.pdf

