1、运动与受力分析
import sympy as sy
import numpy as np
import matplotlib.pyplot as plt
a,a1,b,b1,c,c1,d2,d3,fi,F,L,e= sy.symbols('a,a1,b,b1,c,c1,d2,d3,fi,F,L,e')
'''
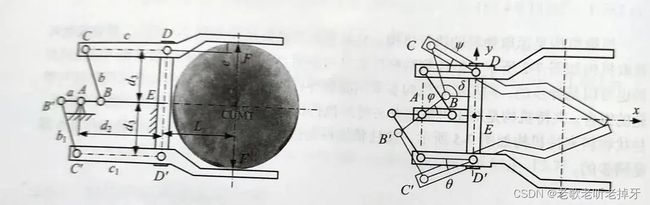
A(-d2,0)
D(0,d3)
B(-d2+a*cos(fi),a*sin(fi))
C(-c*cos(pu),d3+c*sin(pu))
B'=(-d2+a*cos(fi+pi),a*sin(fi+pi))
C'=(c1*cos(theta+pi),-d3+c1*sin(theta+pi))
'''
A1=2*c*(d3-a*sy.sin(fi))
B1=-2*c*(d2-a*sy.cos(fi))
C1=(d2-a*sy.cos(fi))**2+(d3-a*sy.sin(fi))**2+c**2-b**2
pu=2*sy.atan((-A1+sy.sqrt(A1**2+B1**2-C1**2))/(C1-B1))
delta=sy.atan((d3+c*sy.sin(pu)-a*sy.sin(fi))/(-c*sy.cos(pu)+d2-a*sy.cos(fi)))+sy.pi
A2=2*c1*(d3-a*sy.sin(fi))
B2=-2*c1*(d2+a*sy.cos(fi))
C2=(d2+a*sy.cos(fi))**2+(d3-a*sy.sin(fi))**2+c1**2-b1**2
theta=2*sy.atan((-A2+sy.sqrt(A2**2+B2**2-C2**2))/(C2-B2))
beta=sy.atan((d3-c1*sy.sin(theta)+a*sy.sin(fi))/(-c1*sy.cos(theta)+d2+a*sy.cos(fi)))
F23=F*(L*sy.cos(pu)+e*sy.sin(pu))/(c*sy.sin(delta+pu))
F23I=-F*(L*sy.cos(theta)+e*sy.sin(theta))/(c1*sy.sin(beta-theta))
M=F23*a*sy.sin(delta-fi)-F23I*a*(beta-fi)
pu_c=pu.subs({a:30,b:79.5,b1:79.5,c:120,c1:120,d2:120,d3:74,e:15,L:100})
delta_c=delta.subs({a:30,b:79.5,b1:79.5,c:120,c1:120,d2:120,d3:74,e:15,L:100})
fi_v=10*np.pi/180
xa=-120
ya=0
xb=-120+30*np.cos(fi_v)
yb=30*np.sin(fi_v)
Cx=-c*sy.cos(pu)
Cy=d3+c*sy.sin(pu)
xc=Cx.subs({a:30,b:79.5,b1:79.5,c:120,c1:120,d2:120,d3:74,e:15,L:100,fi:fi_v})
yc=Cy.subs({a:30,b:79.5,b1:79.5,c:120,c1:120,d2:120,d3:74,e:15,L:100,fi:fi_v})
xd=0
yd=74
B1x=-d2+a*sy.cos(fi+sy.pi)
B1y=a*sy.sin(fi+sy.pi)
C1x=c1*sy.cos(theta+sy.pi)
C1y=-d3+c1*sy.sin(theta+sy.pi)
xb1=B1x.subs({a:30,b:79.5,b1:79.5,c:120,c1:120,d2:120,d3:74,e:15,L:100,fi:fi_v})
yb1=B1y.subs({a:30,b:79.5,b1:79.5,c:120,c1:120,d2:120,d3:74,e:15,L:100,fi:fi_v})
xc1=C1x.subs({a:30,b:79.5,b1:79.5,c:120,c1:120,d2:120,d3:74,e:15,L:100,fi:fi_v})
yc1=C1y.subs({a:30,b:79.5,b1:79.5,c:120,c1:120,d2:120,d3:74,e:15,L:100,fi:fi_v})
# sy.plot(pu_c,(fi,0,80*sy.pi/180))
# sy.plot(delta_c,(fi,0,80*sy.pi/180))
fig = plt.figure(figsize=(5, 4))
plt.rcParams['xtick.direction'] = 'in' # 将x周的刻度线方向设置向内
plt.rcParams['ytick.direction'] = 'in' # 将y轴的刻度方向设置向内
plt.rcParams['axes.unicode_minus']=False
# plt.rcParams['font.family'] = ["Times New Roman"] # 字体设置为Times NewRoman
plt.rcParams['font.sans-serif'] = ['SimHei']
clist = ['blue', 'red', 'green', 'black', 'darkgreen', 'lime', 'gold', 'purple', 'green', 'cyan', 'salmon', 'grey',
'mediumvioletred', 'darkkhaki', 'gray', 'darkcyan', 'violet', 'powderblue']
markerlst = ['o', '*', 'x', '>', '<', '^', 'D', 'd', '1', '2', '3', '4', 'o', '*', 'x', '>', '<', '^', 'D', 'd',
'1', '2', '3', '4', 'o', '*', 'x', '>', '<', '^', 'D', 'd', '1', '2', '3', '4']
linestylelst = ['-', '--', '-.', ':', '-', '--', '-.', ':', '-', '--', '-.', ':', '-', '--', '-.', ':', '-', '--',
'-.', ':', '-', '--', '-.', ':']
# 圆的基本信息
# 1.圆半径
r = 30
# 2.圆心坐标
a, b = (-120, 0.)
# ==========================================
# 参数方程画圆形
theta = np.arange(0, 2 * np.pi, 0.01)
x = a + r * np.cos(theta)
y = b + r * np.sin(theta)
plt.plot(x, y, c=clist[0])
plt.plot([xa,xb],[ya,yb],c=clist[1])
plt.plot([xb,xc],[yb,yc],c=clist[2])
plt.plot([xc,xd],[yc,yd],c=clist[3])
plt.plot([xd,xd],[-yd,yd],c=clist[4])
plt.plot([xa,xb1],[ya,yb1],c=clist[5])
plt.plot([xb1,xc1],[yb1,yc1],c=clist[6])
plt.plot([xc1,xd],[yc1,-yd],c=clist[7])
plt.show()

2、机构动画
import sympy as sy
import numpy as np
import matplotlib.pyplot as plt
from matplotlib.animation import FuncAnimation
a,a1,b,b1,c,c1,d2,d3,fi,F,L,e= sy.symbols('a,a1,b,b1,c,c1,d2,d3,fi,F,L,e')
'''
A(-d2,0)
D(0,d3)
B(-d2+a*cos(fi),a*sin(fi))
C(-c*cos(pu),d3+c*sin(pu))
B'=(-d2+a*cos(fi+pi),a*sin(fi+pi))
C'=(c1*cos(theta+pi),-d3+c1*sin(theta+pi))

'''
A1=2*c*(d3-a*sy.sin(fi))
B1=-2*c*(d2-a*sy.cos(fi))
C1=(d2-a*sy.cos(fi))**2+(d3-a*sy.sin(fi))**2+c**2-b**2
pu=2*sy.atan((-A1+sy.sqrt(A1**2+B1**2-C1**2))/(C1-B1))
delta=sy.atan((d3+c*sy.sin(pu)-a*sy.sin(fi))/(-c*sy.cos(pu)+d2-a*sy.cos(fi)))+sy.pi
A2=2*c1*(d3-a*sy.sin(fi))
B2=-2*c1*(d2+a*sy.cos(fi))
C2=(d2+a*sy.cos(fi))**2+(d3-a*sy.sin(fi))**2+c1**2-b1**2
theta=2*sy.atan((-A2+sy.sqrt(A2**2+B2**2-C2**2))/(C2-B2))
beta=sy.atan((d3-c1*sy.sin(theta)+a*sy.sin(fi))/(-c1*sy.cos(theta)+d2+a*sy.cos(fi)))
F23=F*(L*sy.cos(pu)+e*sy.sin(pu))/(c*sy.sin(delta+pu))
F23I=-F*(L*sy.cos(theta)+e*sy.sin(theta))/(c1*sy.sin(beta-theta))
M=F23*a*sy.sin(delta-fi)-F23I*a*(beta-fi)
pu_c=pu.subs({a:30,b:79.5,b1:79.5,c:120,c1:120,d2:120,d3:74,e:15,L:100})
delta_c=delta.subs({a:30,b:79.5,b1:79.5,c:120,c1:120,d2:120,d3:74,e:15,L:100})
Cx = -c * sy.cos(pu)
Cy = d3 + c * sy.sin(pu)
B1x = -d2 + a * sy.cos(fi + sy.pi)
B1y = a * sy.sin(fi + sy.pi)
C1x = c1 * sy.cos(theta + sy.pi)
C1y = -d3 + c1 * sy.sin(theta + sy.pi)
cx = sy.lambdify(fi, Cx.subs({a: 30, b: 79.5, b1: 79.5, c: 120, c1: 120, d2: 120, d3: 74, e: 15, L: 100}), modules='numpy')
cy = sy.lambdify(fi, Cy.subs({a: 30, b: 79.5, b1: 79.5, c: 120, c1: 120, d2: 120, d3: 74, e: 15, L: 100}), modules='numpy')
b1x = sy.lambdify(fi, B1x.subs({a: 30, b: 79.5, b1: 79.5, c: 120, c1: 120, d2: 120, d3: 74, e: 15, L: 100}), modules='numpy')
b1y = sy.lambdify(fi, B1y.subs({a: 30, b: 79.5, b1: 79.5, c: 120, c1: 120, d2: 120, d3: 74, e: 15, L: 100}), modules='numpy')
c1x = sy.lambdify(fi, C1x.subs({a: 30, b: 79.5, b1: 79.5, c: 120, c1: 120, d2: 120, d3: 74, e: 15, L: 100}), modules='numpy')
c1y = sy.lambdify(fi, C1y.subs({a: 30, b: 79.5, b1: 79.5, c: 120, c1: 120, d2: 120, d3: 74, e: 15, L: 100}), modules='numpy')
# sy.plot(pu_c,(fi,0,80*sy.pi/180))
# sy.plot(delta_c,(fi,0,80*sy.pi/180))

fig = plt.figure(figsize=(5, 4))
plt.rcParams['xtick.direction'] = 'in'  # 将x周的刻度线方向设置向内
plt.rcParams['ytick.direction'] = 'in'  # 将y轴的刻度方向设置向内
plt.rcParams['axes.unicode_minus']=False
# plt.rcParams['font.family'] = ["Times New Roman"]  # 字体设置为Times NewRoman
plt.rcParams['font.sans-serif'] = ['SimHei']
clist = ['blue', 'red', 'green', 'black', 'darkgreen', 'lime', 'gold', 'purple', 'green', 'cyan', 'salmon', 'grey',
         'mediumvioletred', 'darkkhaki', 'gray', 'darkcyan', 'violet', 'powderblue']
markerlst = ['o', '*', 'x', '>', '<', '^', 'D', 'd', '1', '2', '3', '4', 'o', '*', 'x', '>', '<', '^', 'D', 'd',
             '1', '2', '3', '4', 'o', '*', 'x', '>', '<', '^', 'D', 'd', '1', '2', '3', '4']
linestylelst = ['-', '--', '-.', ':', '-', '--', '-.', ':', '-', '--', '-.', ':', '-', '--', '-.', ':', '-', '--',
                '-.', ':', '-', '--', '-.', ':']

# 创建绘图框架
fig, ax = plt.subplots()

# 定义每帧图像的处理函数
'''
定义了一个处理函数draw_frame(),该函数根据当前的“帧数”(即第几张图)生成对应的x和y的坐标点
'''
def draw_frame(i):
    fi_v = i * np.pi / 180
    xa = -120
    ya = 0
    xb = -120 + 30 * np.cos(fi_v)
    yb = 30 * np.sin(fi_v)

    xc = cx(fi_v)
    yc = cy(fi_v)
    xd = 0
    yd = 74

    xb1 = b1x(fi_v)
    yb1 = b1y(fi_v)
    xc1 = c1x(fi_v)
    yc1 = c1y(fi_v)
    # 绘制图形
    ax.clear()
    r = 30
    # 2.圆心坐标
    x0, y0 = (-120, 0.)
    # ==========================================
    # 参数方程画圆形
    theta = np.arange(0, 2 * np.pi, 0.01)
    x = x0 + r * np.cos(theta)
    y = y0 + r * np.sin(theta)
    ax.plot(x, y, c=clist[0])
    ax.plot([xa, xb], [ya, yb], c=clist[1])
    ax.plot([xb, xc], [yb, yc], c=clist[2])
    ax.plot([xc, xd], [yc, yd], c=clist[3])
    ax.plot([xd, xd], [-yd, yd], c=clist[4])
    ax.plot([xa, xb1], [ya, yb1], c=clist[5])
    ax.plot([xb1, xc1], [yb1, yc1], c=clist[6])
    ax.plot([xc1, xd], [yc1, -yd], c=clist[7])
    ax.axis("equal")
    # 固定X轴、Y轴的范围
    ax.set_ylim(ymin=-150, ymax=150)
    ax.set_xlim(xmin=-160, xmax=10)
    plt.tight_layout()


# 生成动画对象
'''
FuncAnimation()函数生成了一个动画对象anim,该对象会在循环中调用draw_frame()函数,并以50毫秒的时间间隔循环展示100帧图像
'''
anim = FuncAnimation(fig, draw_frame, frames=80, interval=50)
# 使用pillow将动画保存为GIF图片
anim.save('finger.gif', writer='pillow')
