控制理论-Nichols Chart
工具
对数计算器
三角函数计算器
课件原文
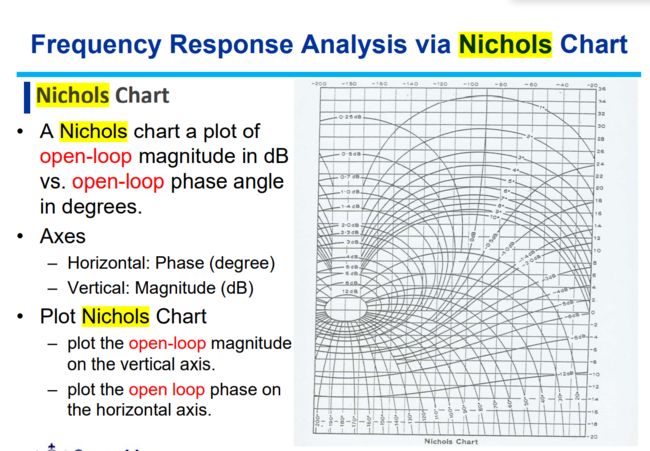
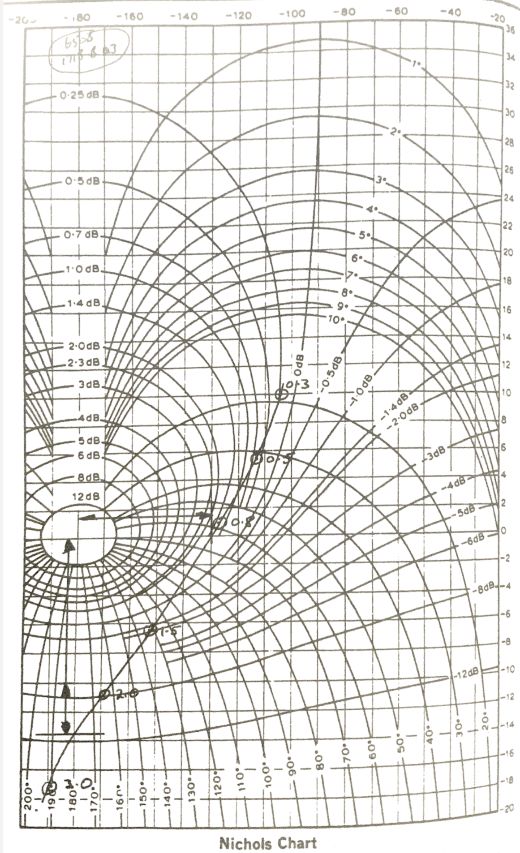
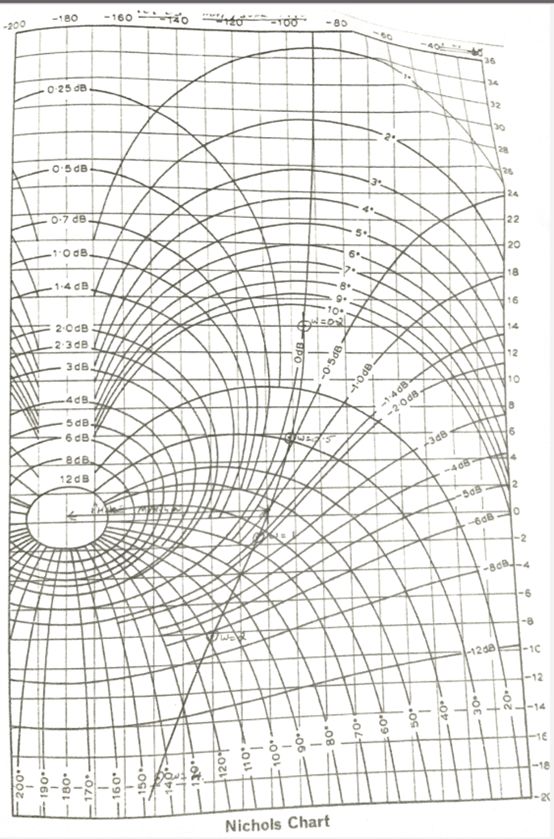
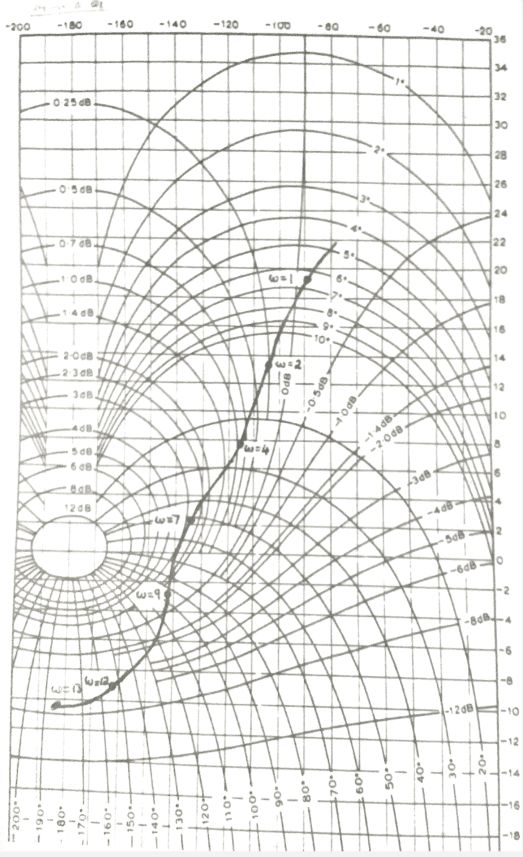
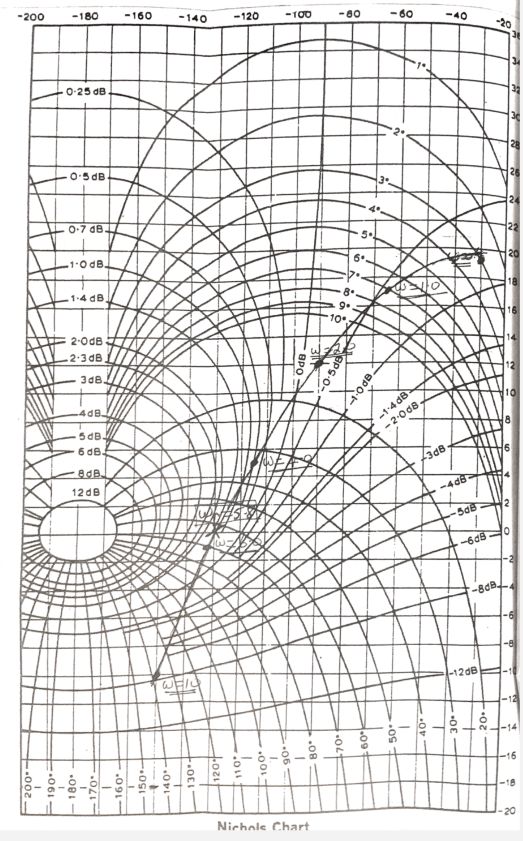
尼克尔斯图,以dB表示开环幅值,以度表示开环相位角。
•轴 -水平:相位(度) -垂直:幅值(dB)
•绘制尼克尔斯图 -在纵轴上绘制开环幅值。 -在横轴上绘制开环相位。
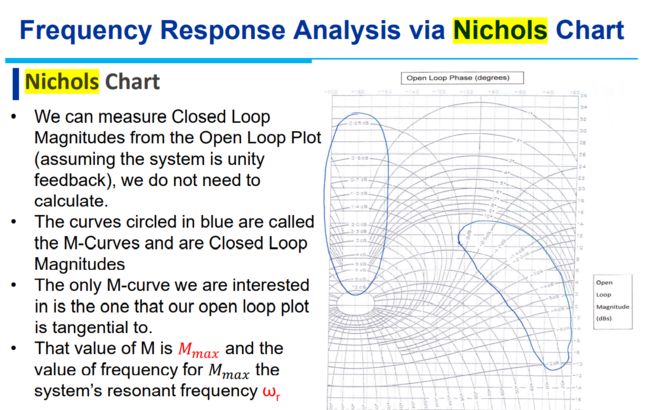
我们可以从开环图(假设系统是统一反馈)中测量闭环幅度,我们不需要计算。
•蓝色圈出的曲线被称为m曲线,是闭环幅度
•我们唯一感兴趣的m曲线是开环图与之切线的曲线。
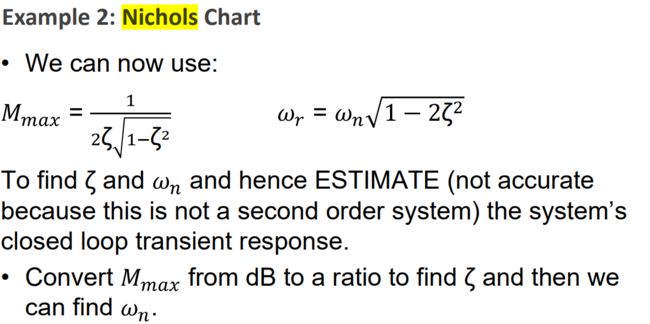
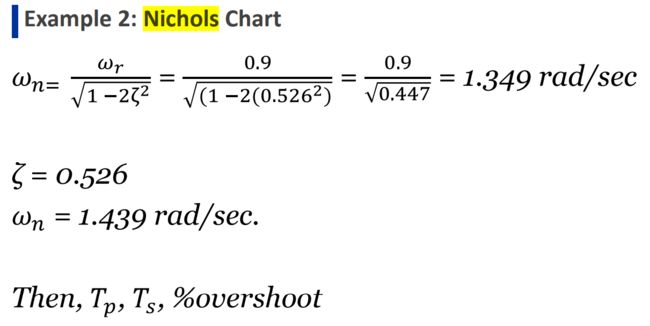
•M的值为Mmax, Mmax的频率为系统谐振频率ωr
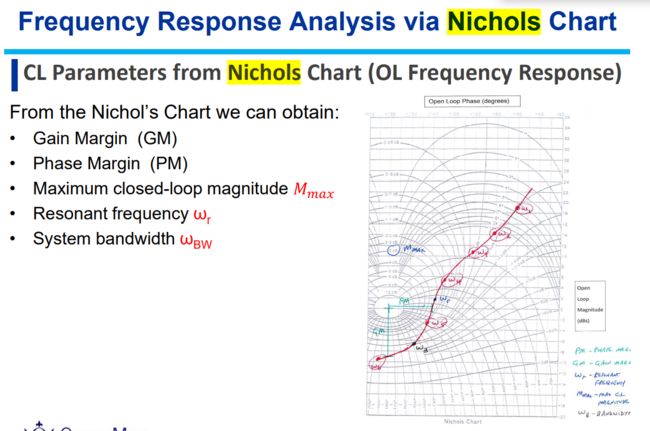
来自Nichols图的CL参数(OL频响)
从尼科尔图中我们可以得到:
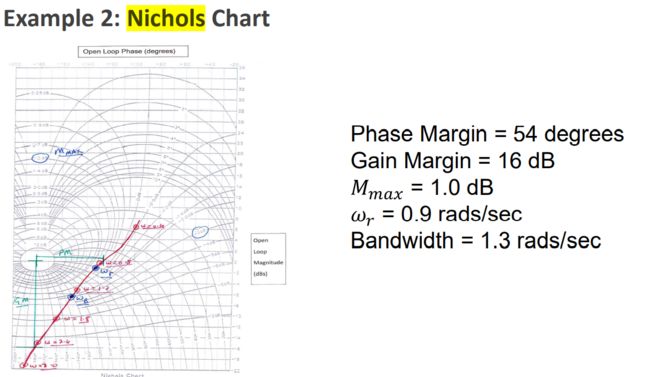
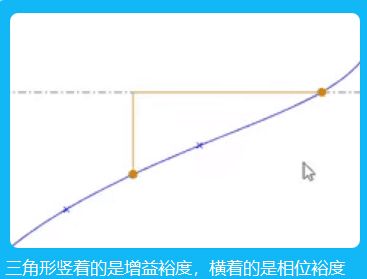
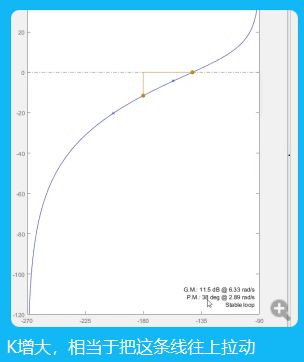
•利润(通用) •相位裕度(PM) •最大闭环震级Mmax •谐振频率ωr •系统带宽ωBW
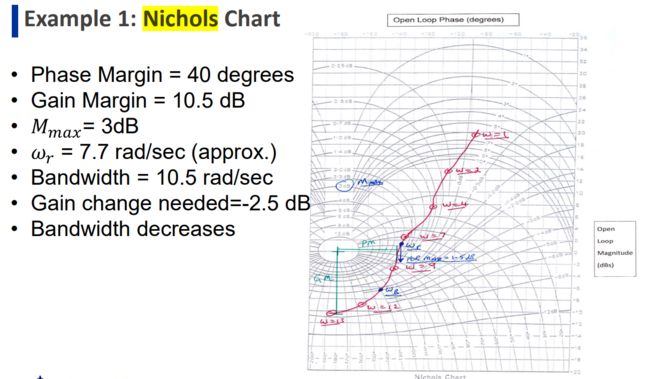
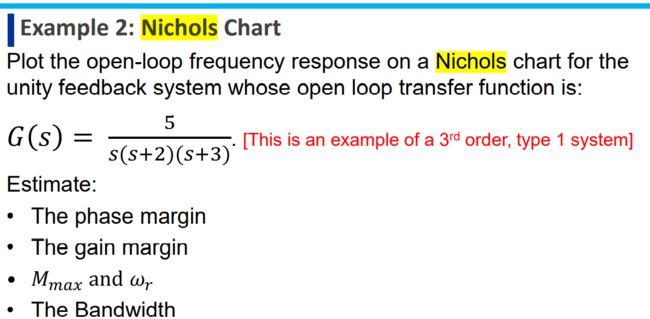
对某系统进行了开环频率响应测试,结果见表。绘制尼克尔斯图并估计:相位裕度,增益裕度,ωr ωBW,获得1.5dB Mmax所需的增益变化。
相位裕度= 40度 •增益裕度= 10.5 dB •Mmax = 3dB •ωr = 7.7 rad/sec(约) •带宽= 10.5 rad/sec •增益变化需要=-2.5 dB •带宽降低
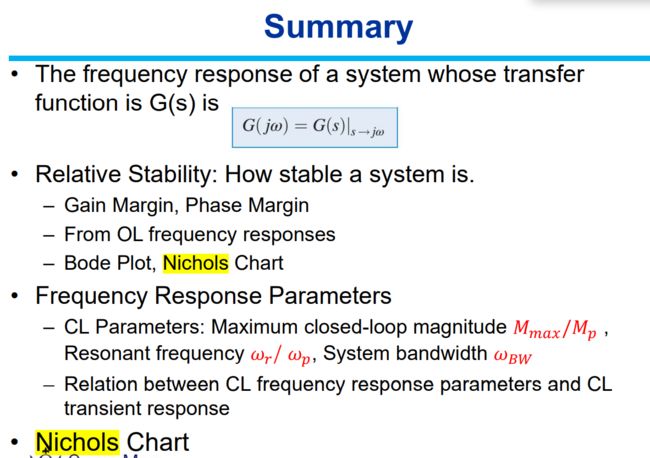
传递函数为G(s)的系统的频响为
相对稳定性:系统的稳定性。
-增益裕度,相位裕度
-来自OL频率响应
-波德图,尼科尔斯图
•频率响应参数
—CL参数:闭环最大幅值Mmax/Mp,谐振频率ωr/ωp,系统带宽ωBW
- CL频响参数与CL瞬态响应的关系
习题
1
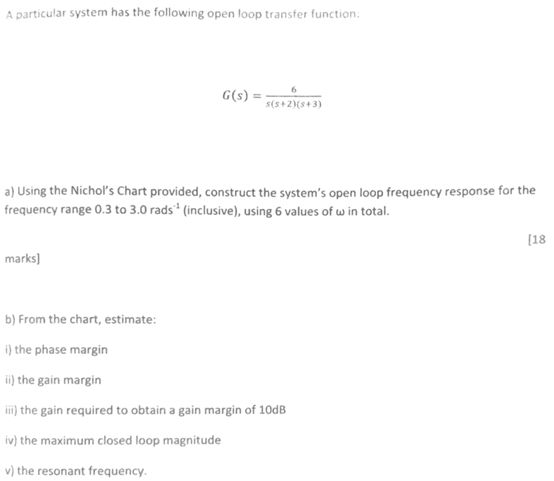
A particular system has the following open loop transfer function.
a) Using the Nichol's Chart provided, construct the system's open loop frequency response for the
frequency range 0.3 to 3.0 rads . (inclusive), using 6 values of w in total.
b) From the chart, estimate:
i) the phase margin
ii) the gain margin
iii)the gain required to obtain a gain margin of 10dB
iv) the maximum closed loop magnitude
v) the resonant frequency.
一个特定的系统具有以下开环传递函数。
a)利用所提供的尼克尔图,构造系统的开环频率响应
频率范围0.3至3.0拉德。(含),共使用6个w值。
b)从图表中估计:
I)相位裕度
Ii)收益边际
iii)获得10dB增益裕度所需的增益
Iv)最大闭环幅值
V)谐振频率。
2
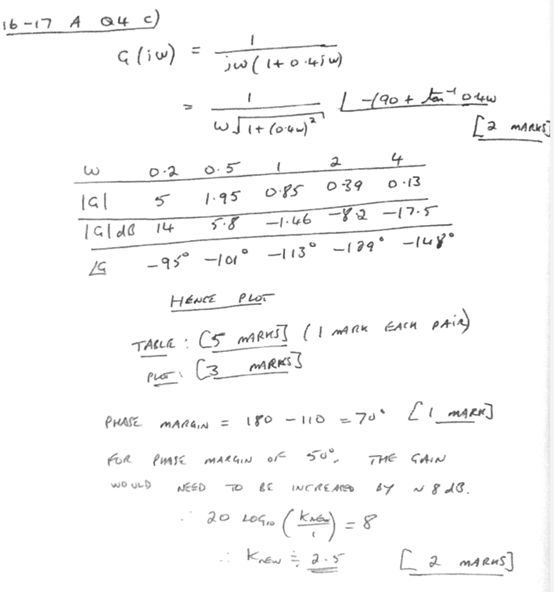
c)A particular device has the following transfer function
i) Given that K = 1 and T= 0.4 second, construct the Nichols plot on the paper provided using
angular frequencies of 0.2,0.5,1, 2 and 4 rad/sec.
ii) Hence determine the phase margin and the value of K that would result in a phase margin of 50°.
c)特定设备具有以下传递函数
i)假设K = 1和T= 0.4秒,在提供的纸上使用角频率为0.2、0.5、1、2和4拉德/秒构建Nichols图。
ii)因此,确定相位裕度和K值,将导致相位裕度为50°。
3
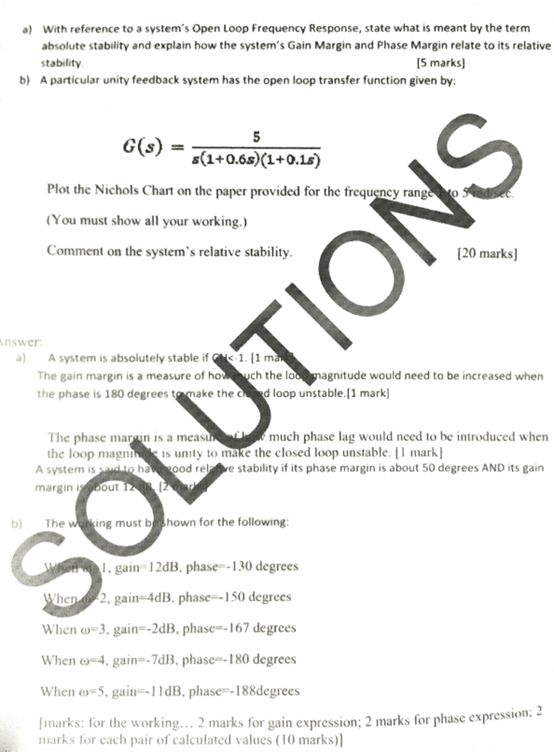
a) With reference to a system's Open Loop Frequency Response, state what is meant by the term absolute stability and explain how the system's Gain Margin and Phase Margin relate to its relative stability.
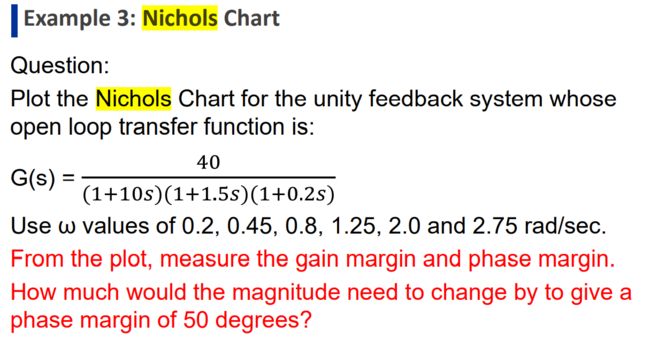
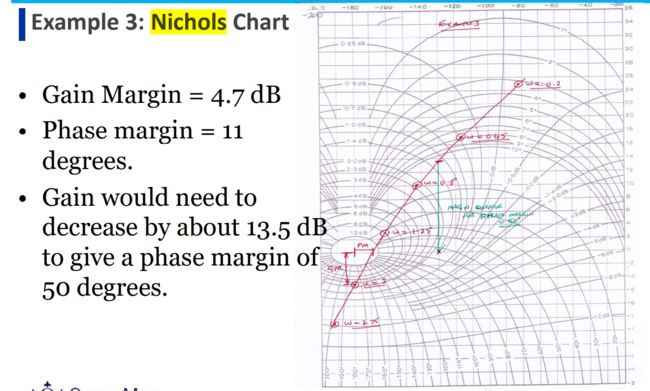
b) A particular unity feedback system has the open loop transfer function given by:
Plot the Nichols Chart on the paper provided for the frequency range to 5 rad/sec ( You must show all your working.)
Comment on the system's relative stability.
a)参考系统的开环频率响应,说明绝对稳定性一词的含义,并解释系统的增益裕量和相位裕量与其相对稳定性的关系。
b)某一特定单位反馈系统的开环传递函数为:
在提供的频率范围为5 rad/sec的纸上绘制尼克尔斯图(必须显示所有工作)。
评论系统的相对稳定性。
answer:
a)A system is absolutely stable if GH<1.
The gain margin is a measure of how much the loop magnitude would need to be increased when the phase is 180 degrees to make the closed loop unstable.
The phase margin is a measure of how much phase lag would need to be introduced when
the loop magnitude is unity to make the closed loop unstable.
A system is said to have good relative stability if its phase margin is about 50 degrees AND its gain margin is about 12 db
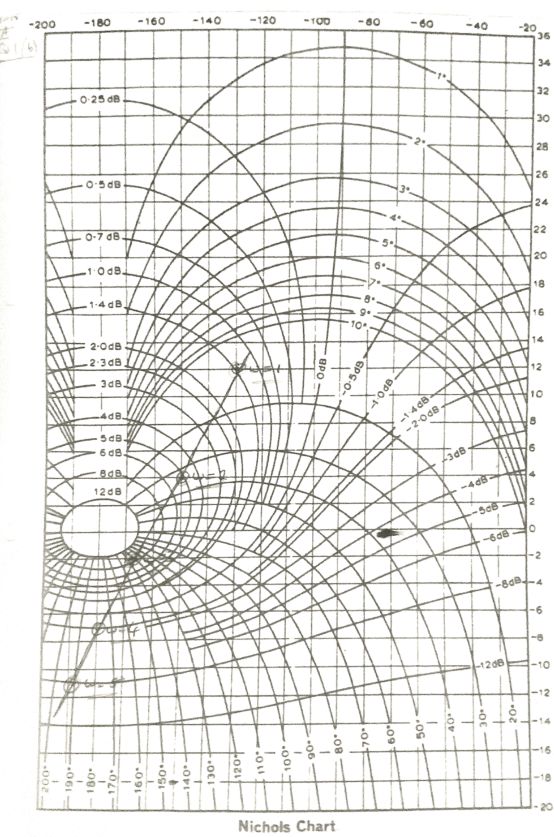
b)The working must be shown for the following:
When w=1, gain=12dB, phase=-130 degrees
When w=2, gain=4dB, phase=-150 degrees
When w=3, gain=-2dB, phase=-167 degrees
When w=-4,gain=-7dB, phase=-180 degrees
When w=5, gain=-11dB, phase=-188 degrees
a)当GH<1时,系统绝对稳定。
增益裕度是测量当相位为180度时需要增加多少环幅值才能使闭环不稳定的度量。
相位裕度是测量需要引入多少相位滞后的方法
环路大小为单位,使闭环不稳定。
如果系统的相位裕度约为50度,增益裕度约为12 db,则系统具有良好的相对稳定性
b)以下方面的工作必须展示:
当w=1时,增益=12dB,相位=-130度
当w=2时,增益=4dB,相位=-150度
当w=3时,增益=-2dB,相位=-167度
当w=-4时,增益=-7dB,相位=-180度
当w=5时,增益=-11dB,相位=-188度
4
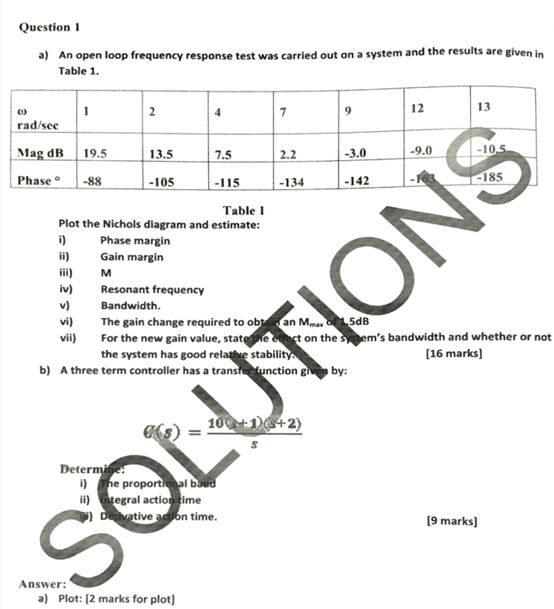
a)An open loop frequency response test was carried out on a system and the results are given in
Plot the Nichols diagram and estimate
Phase margin/Gain margin/M/Resonant frequency/Bandwidth.
The gain change required to obtain an Mmax of 1.5dB
For the new gain value, state the effect on the system's bandwidth and whether or not the system has good relative stability:
b)A three term controller has a transfer function given by:
The proportional band/Integral action time/Derivative action time.
a)对某系统进行开环频响试验,试验结果载于
绘制Nichols图并进行估计
相位裕度/增益裕度/M/谐振频率/带宽。
获得1.5dB Mmax所需的增益变化
对于新的增益值,说明对系统带宽的影响,以及系统是否具有良好的相对稳定性:
b)三项控制器的传递函数为:
比例带/积分动作时间/导数动作时间。
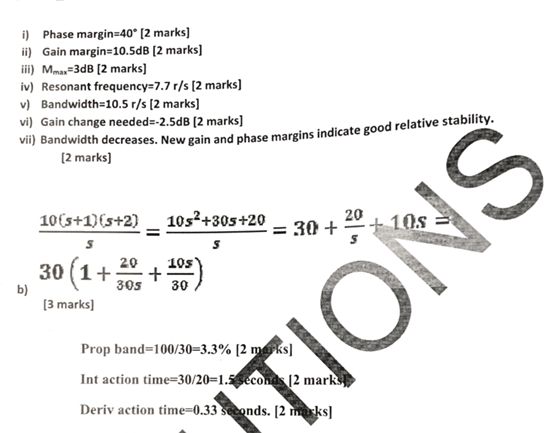
i)Phase margin=40°
ii)Gain margin=10.5dB
iii)Mmax=3dB
iv)Resonant frequency=7.7 r/s
v)Bandwidth=10.5 r/s
vi)Gain change needed=-2.5dB
vii) Bandwidth decreases New gain and phase margins indicate good relative stability.
Prop band=100/30=3.3%
Int action time=30/20=1.5 seconds
Deriv action time=0.33 seconds.
1)阶段裕度= 40°
2)增益裕度= 10.5 db
3) Mmax = 3 db
iv)谐振频率=7.7 r/s
v)带宽= 10.5 r / s
vi)需要的增益变化=-2.5dB
新的增益和相位边缘显示出较好的相对稳定性。
支持带= 100/30 = 3.3%
Int动作时间=30/20=1.5秒
衍生动作时间=0.33秒。
5
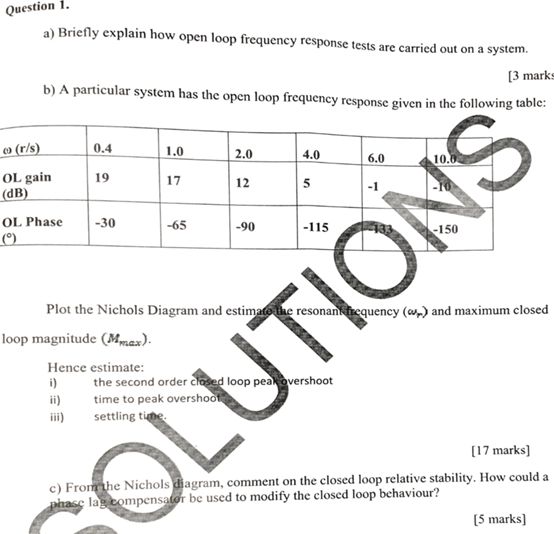
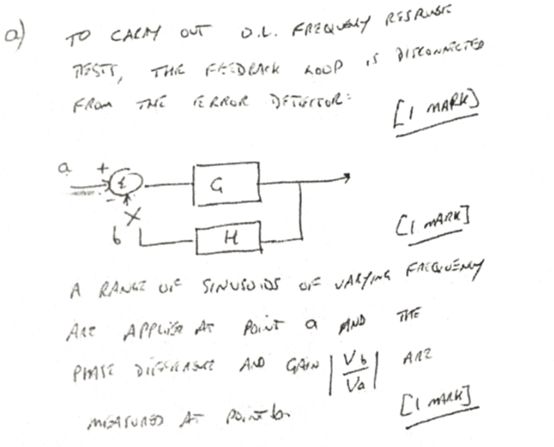
a) Briefly explain how open loop frequency response tests are carried out on a system.
b) A particular system has the open loop frequency response given in the following table:
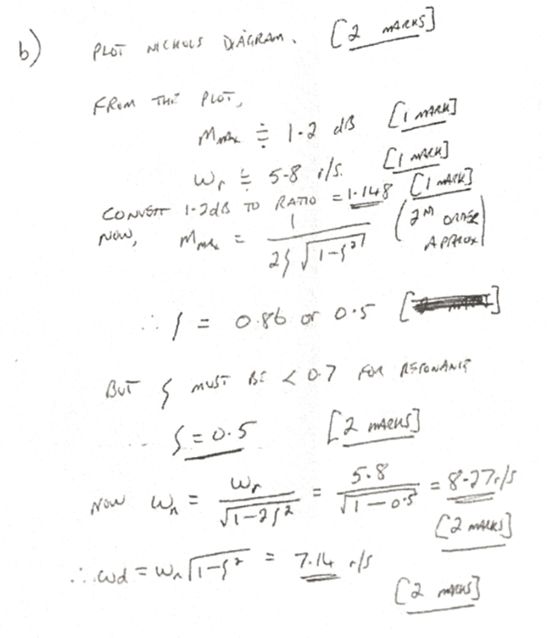
Plot the Nichols Diagram and estimate the resonant frequency (wr) and maximum closed
loop magnitude (Mmax).
Hence estimate:
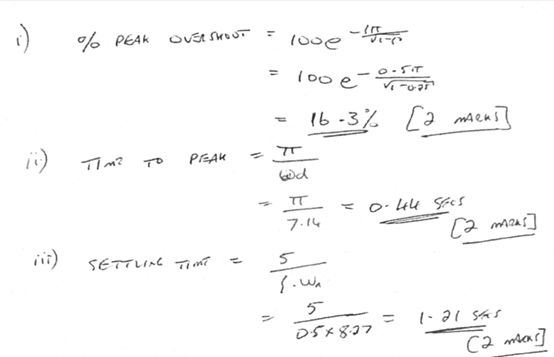
the second order closed loop peak overshoot/time to peak overshoot/settling tine
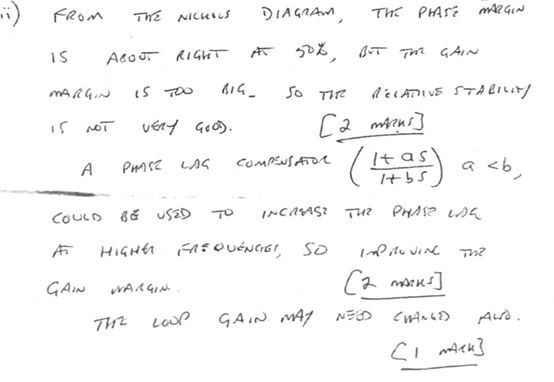
c) From the Nichols diagram, comment on the closed loop relative stability. How could a phase lag compensator be used to modify the closed loop behavior?
a)简要说明如何在系统上进行开环频率响应测试。
b)某系统的开环频率响应如下表所示:
绘制尼克尔斯图,并估计谐振频率(wr)和最大闭合
环幅值(Mmax)。
因此估计:
二阶闭环峰值超调/到峰值超调时间/沉降时间
c)从Nichols图中,评价闭环的相对稳定性。如何使用相位滞后补偿器来修改闭环行为?
matlab-B站解析
matlab链接
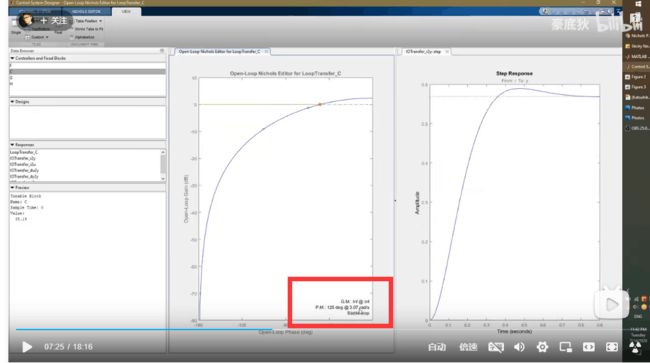
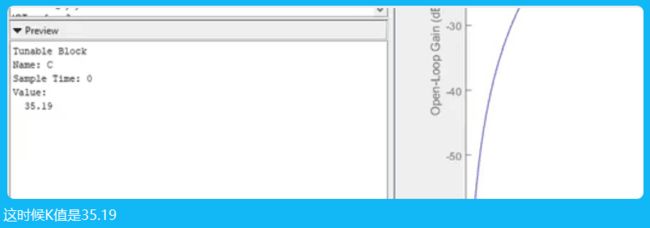
什么是 Nichols Chart?讲一个 Matlab 用它来设计补偿器的例子
相位125,3弧度每秒,右图到0.5前都是上升趋势
