opencv练习-案例
import cv2 as cv
import numpy as np
from matplotlib import pyplot as plt
%matplotlib inline
图像分割是计算机将图像分割成多个区域的过程
使用阈值分割图像,产生两个区域
打开图像文件
img = cv.imread('snake.png',cv.IMREAD_COLOR)
gray = cv.cvtColor(img,cv.COLOR_BGR2GRAY)
b,g,r = cv.split(img)
src = cv.merge([r,g,b])
plt.subplot(121),plt.imshow(src)
plt.title('original image'),plt.xticks([]),plt.yticks([])
plt.subplot(122),plt.imshow(gray,cmap='gray')
plt.title('gray image'),plt.xticks([]),plt.yticks([])
plt.show()
plt.imshow(gray,cmap=‘gray’) - - - cmap可以赋值的值。可以改变图片的颜色
‘Accent’, ‘Accent_r’, ‘Blues’, ‘Blues_r’, ‘BrBG’, ‘BrBG_r’, ‘BuGn’, ‘BuGn_r’, ‘BuPu’, ‘BuPu_r’, ‘CMRmap’, ‘CMRmap_r’, ‘Dark2’, ‘Dark2_r’, ‘GnBu’, ‘GnBu_r’, ‘Greens’, ‘Greens_r’, ‘Greys’, ‘Greys_r’, ‘OrRd’, ‘OrRd_r’, ‘Oranges’, ‘Oranges_r’, ‘PRGn’, ‘PRGn_r’, ‘Paired’, ‘Paired_r’, ‘Pastel1’, ‘Pastel1_r’, ‘Pastel2’, ‘Pastel2_r’, ‘PiYG’, ‘PiYG_r’, ‘PuBu’, ‘PuBuGn’, ‘PuBuGn_r’, ‘PuBu_r’, ‘PuOr’, ‘PuOr_r’, ‘PuRd’, ‘PuRd_r’, ‘Purples’, ‘Purples_r’, ‘RdBu’, ‘RdBu_r’, ‘RdGy’, ‘RdGy_r’, ‘RdPu’, ‘RdPu_r’, ‘RdYlBu’, ‘RdYlBu_r’, ‘RdYlGn’, ‘RdYlGn_r’, ‘Reds’, ‘Reds_r’, ‘Set1’, ‘Set1_r’, ‘Set2’, ‘Set2_r’, ‘Set3’, ‘Set3_r’, ‘Spectral’, ‘Spectral_r’, ‘Wistia’, ‘Wistia_r’, ‘YlGn’, ‘YlGnBu’, ‘YlGnBu_r’, ‘YlGn_r’, ‘YlOrBr’, ‘YlOrBr_r’, ‘YlOrRd’, ‘YlOrRd_r’, ‘afmhot’, ‘afmhot_r’, ‘autumn’, ‘autumn_r’, ‘binary’, ‘binary_r’, ‘bone’, ‘bone_r’, ‘brg’, ‘brg_r’, ‘bwr’, ‘bwr_r’, ‘cividis’, ‘cividis_r’, ‘cool’, ‘cool_r’, ‘coolwarm’, ‘coolwarm_r’, ‘copper’, ‘copper_r’, ‘cubehelix’, ‘cubehelix_r’, ‘flag’, ‘flag_r’, ‘gist_earth’, ‘gist_earth_r’, ‘gist_gray’, ‘gist_gray_r’, ‘gist_heat’, ‘gist_heat_r’, ‘gist_ncar’, ‘gist_ncar_r’, ‘gist_rainbow’, ‘gist_rainbow_r’, ‘gist_stern’, ‘gist_stern_r’, ‘gist_yarg’, ‘gist_yarg_r’, ‘gnuplot’, ‘gnuplot2’, ‘gnuplot2_r’, ‘gnuplot_r’,'gray', ‘gray_r’, ‘hot’, ‘hot_r’, ‘hsv’, ‘hsv_r’, ‘inferno’, ‘inferno_r’, ‘jet’, ‘jet_r’, ‘magma’, ‘magma_r’, ‘nipy_spectral’, ‘nipy_spectral_r’, ‘ocean’, ‘ocean_r’, ‘pink’, ‘pink_r’, ‘plasma’, ‘plasma_r’, ‘prism’, ‘prism_r’, ‘rainbow’, ‘rainbow_r’, ‘seismic’, ‘seismic_r’, ‘spring’, ‘spring_r’, ‘summer’, ‘summer_r’, ‘tab10’, ‘tab10_r’, ‘tab20’, ‘tab20_r’, ‘tab20b’, ‘tab20b_r’, ‘tab20c’, ‘tab20c_r’, ‘terrain’, ‘terrain_r’, ‘turbo’, ‘turbo_r’, ‘twilight’, ‘twilight_r’, ‘twilight_shifted’, ‘twilight_shifted_r’, ‘viridis’, ‘viridis_r’, ‘winter’, ‘winter_r’
图像的OTSU二值分割
otsu大津阈值法分割
通过最小化两个区域的加权方差实现图像分割
ret,thresh = cv.threshold(gray,0,255,cv.THRESH_OTSU)
plt.imshow(thresh,cmap='gray')
plt.title('otsu'),plt.axis('off')
cv.imwrite('otsu.jpg',thresh)
plt.show()
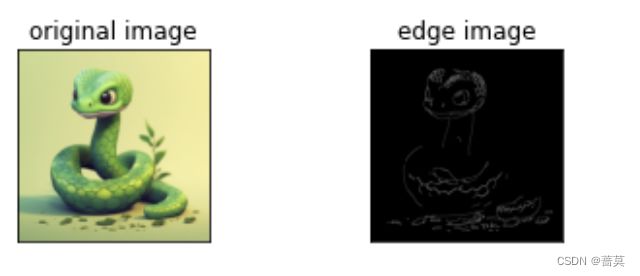
图像的canny边缘检测
标识数组图像中亮度变化明显的点
cv.Canny是一个边缘检测算法,用于检测图像中物体的边缘。它的参数包括:
-
gray: 输入的灰度图像
-
100: 低阈值,任何梯度值低于该值的边缘都会被认为是不重要的,会被过滤掉。
-
200: 高阈值,梯度值高于该值的边缘会被认为是重要的边缘。
Canny算法会根据给定的阈值进行边缘检测,一般来说,高阈值是低阈值的三倍左右。如果一个像素梯度值超过高阈值,则认为它是一个强边缘;如果一个像素梯度值在低阈值和高阈值之间,则认为它是一个弱边缘;如果一个像素梯度值低于低阈值,则被认为是不重要的边缘,会被过滤掉。Canny算法返回的是一个二值图像,其中边缘像素值为白色,非边缘像素值为黑色。
img = cv.imread('snake.png',cv.IMREAD_COLOR)
edges = cv.Canny(gray,100,200)# 二维数组
b,g,r = cv.split(img)
src = cv.merge([r,g,b])
plt.subplot(221),plt.imshow(src)
plt.title('original image'),plt.xticks([]),plt.yticks([])
plt.subplot(222),plt.imshow(edges,cmap='gray')
plt.title('edge image'),plt.xticks([]),plt.yticks([])
plt.show()
图像的harris corner角点检测
gray = np.float32(gray)
dst = cv.cornerHarris(gray,2,3,0.04)
# result is dilated for marking the corners,not important
dst = cv.dilate(dst,None)
# threshold for an optimal value,it may vary depending on the image
img[dst > 0.01 * dst.max()] = [0,0,255]
b,g,r = cv.split(img)
src = cv.merge([r,g,b])
cv.imwrite('harris.jpg',src)
plt.imshow(src)


