【GNN 03】PyG
工具包安装: 不要pip安装
https://github.com/pyg-team/pytorch_geometric https://github.com/pyg-team/pytorch_geometric
import torch
import networkx as nx
import matplotlib.pyplot as plt


def visualize_graph(G, color):
    plt.figure(figsize=(7, 7))
    plt.xticks([])
    plt.yticks([])
    nx.draw_networkx(G, pos=nx.spring_layout(G, seed=42), with_labels=False, node_color=color, cmap="Set2")
    plt.show()


def visualize_embedding(h, color, epoch=None, loss=None):
    plt.figure(figsize=(7, 7))
    plt.xticks([])
    plt.yticks([])
    h = h.detach().cpu().numpy()
    plt.scatter(h[:, 0], h[:, 1], s=140, c=color, cmap="Set2")
    if epoch is not None and loss is not None:
        plt.xlabel(f'Epoch: {epoch}, Loss: {loss.item():.4f}', fontsize=16)
    plt.show()
1 dataset
from torch_geometric.datasets import KarateClub

dataset = KarateClub()
print(f'Dataset: idataset] :')
print('===================')
print(f'Number of graphs: {len(dataset)}')
print(f'Number of features: {dataset.num_features}')
print(f'Number of classes: {dataset.num_classes}')
data = dataset[0]
print(data)2 source-target
edge_index = data.edge_index
# print(edge_index.t())
3 Visual presentation using networkx
from torch_geometric.utils import to_networkx

G = to_networkx(data, to_undirected=True)
visualize_graph(G, color=data.y)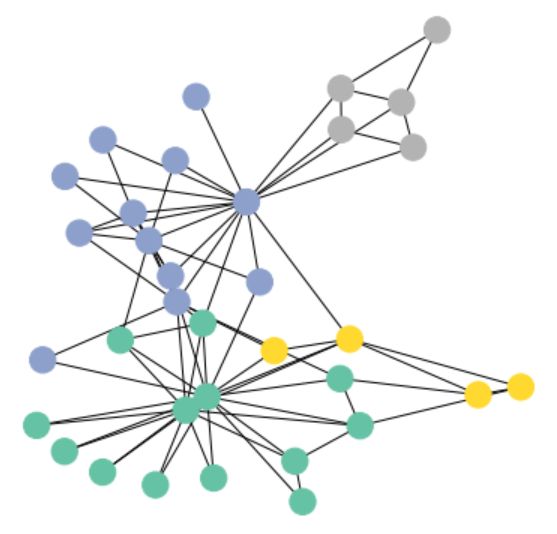
4 GCN model
import torch
from torch.nn import Linear
from torch_geometric.nn import GCNConv
import torch.sparse

class GCN(torch.nn.Module):
    def __init__(self):
        super().__init__()
        torch.manual_seed(1234)
        self.conv1 = GCNConv(dataset.num_features, 4, cache=False)
        self.conv2 = GCNConv(4, 4)
        self.conv3 = GCNConv(4, 2)
        self.classifier = Linear(2, dataset.num_classes)

    def forward(self, x, edge_index):
        h = self.conv1(x, edge_index) # edge_index 邻接矩阵
        h = h.tanh()
        h = self.conv2(h, edge_index)
        h = h.tanh()
        h = self.conv3(h, edge_index)
        h = h.tanh()

        out = self.classifier(h)
        return out, h

5 Two-dimensional vector
model = GCN()
print(model)

_, h = model(data.x, data.edge_index)
visualize_embedding(h, color=data.y)
6 Training model(semi-supervised)
import time

model = GCN()
criterion = torch.nn.CrossEntropyLoss()  # Define loss criterion.
optimizer = torch.optim.Adam(model.parameters(), lr=0.01)  # Define optimizer.


def train(data):
    optimizer.zero_grad()
    out, h = model(data.x, data.edge_index)  # h是两维向量,主要是为了咱们画个图
    loss = criterion(out[data.train_mask], data.y[data.train_mask])  # semi-supervised
    loss.backward()
    optimizer.step()
    return loss, h


for epoch in range(401):
    loss, h = train(data)
    if epoch % 10 == 0:
        visualize_embedding(h, color=data.y, epoch=epoch, loss=loss)
        time.sleep(0.3)