一,模板匹配

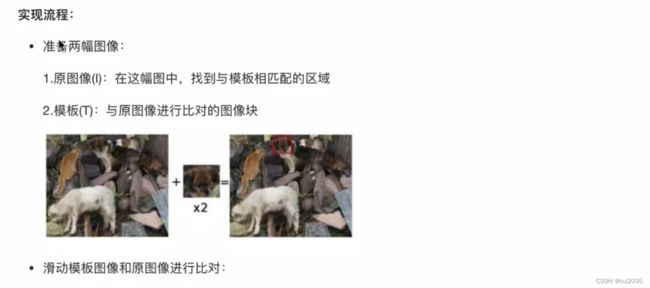
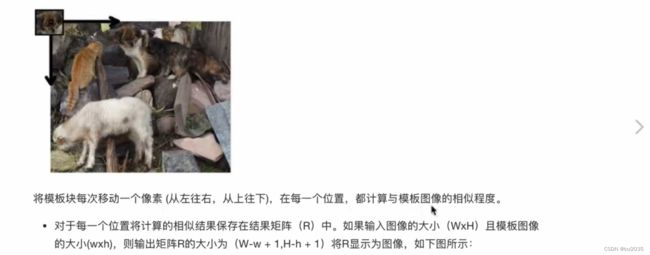
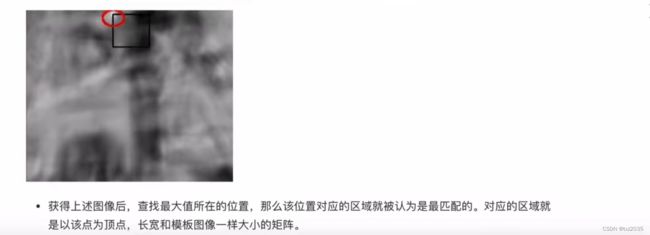
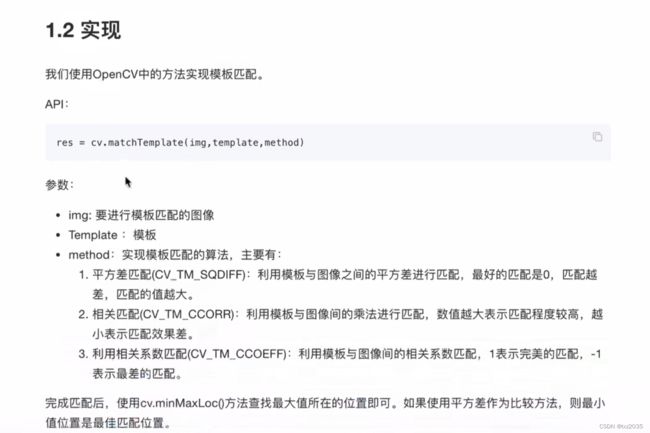
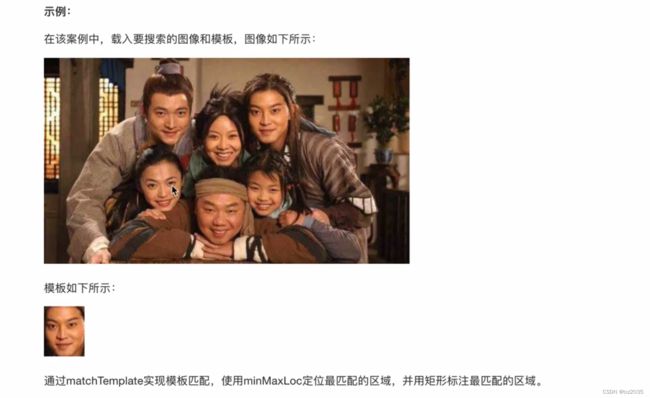
1.1代码实现
import cv2 as cv
import numpy as np
import matplotlib.pyplot as plt
from pylab import mpl
mpl.rcParams['font.sans-serif'] = ['SimHei']
img = cv.imread("cat.png")
template = cv.imread(r"E:\All_in\opencv\cat_1.png")
h,w,l = template.shape
res = cv.matchTemplate(img,template,cv.TM_CCORR)
min_val,max_val,min_loc,max_loc = cv.minMaxLoc(res)
"""确定最佳匹配位置的左上角坐标(top_left)和
右下角坐标(bottom_right),并在图像上绘制矩形框来表示匹配位置:"""
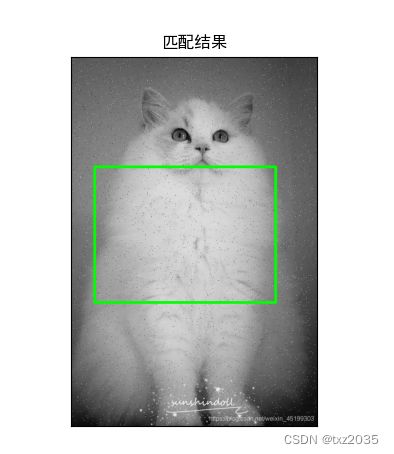
top_left = max_loc
bottom_right = (top_left[0] + w,top_left[1] + h)
cv.rectangle(img , top_left,bottom_right,(0,255,0),5)
"""top_left 和 bottom_right 分别是矩形框的左上角和右下角坐标,
(0, 255, 0) 是矩形框的颜色,(0, 255, 0) 表示绿色,2 是矩形框的线宽。"""
plt.imshow(img[:,:,::-1])
plt.title('匹配结果'),plt.xticks([]),plt.yticks([])
plt.show()
1.2效果展示
二,霍夫线变换
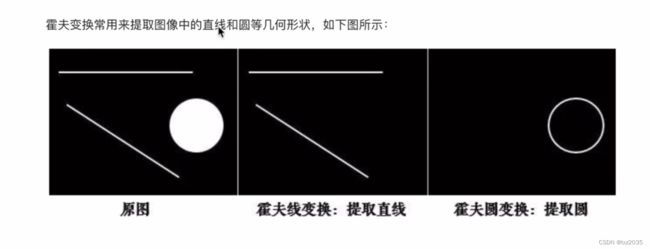
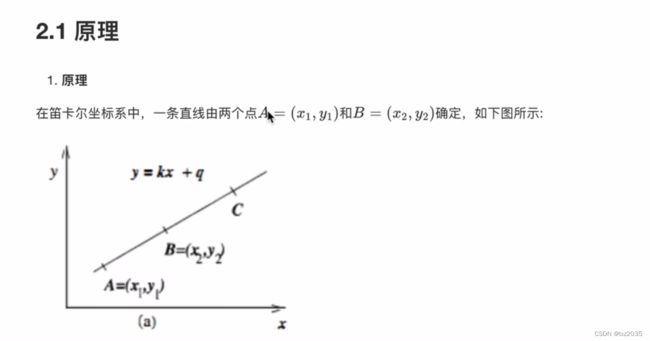
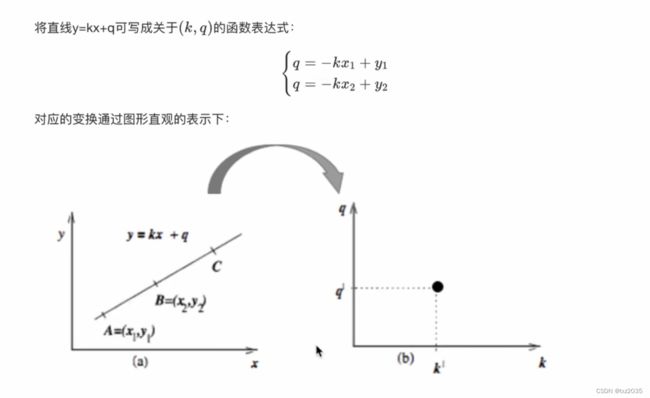
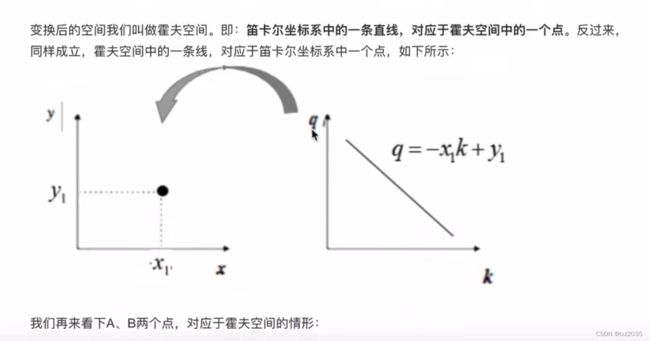
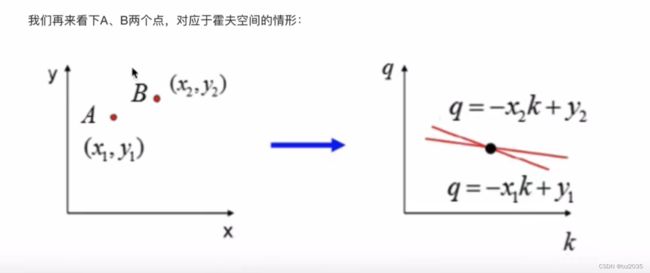
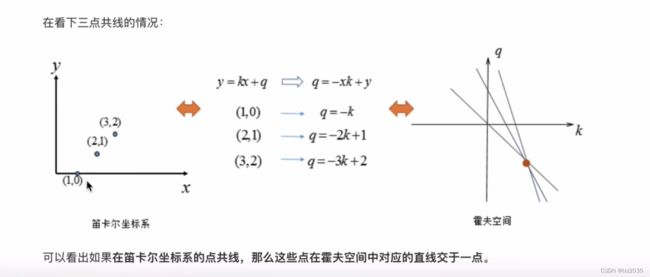
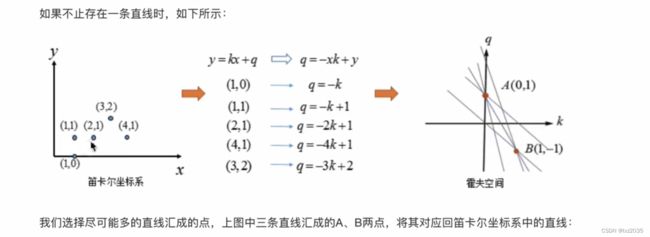
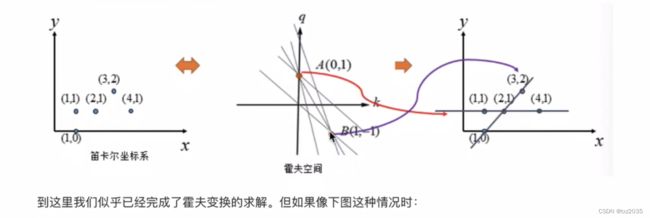
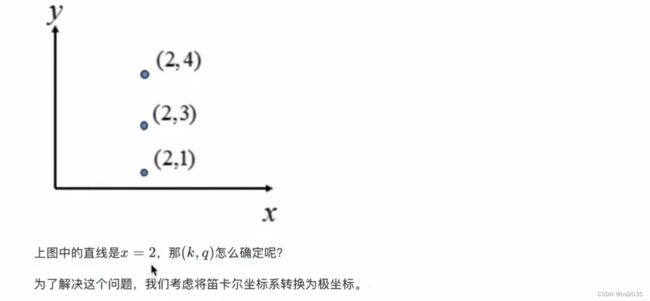

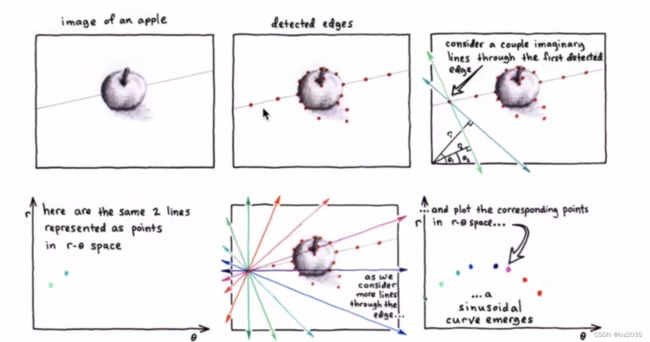
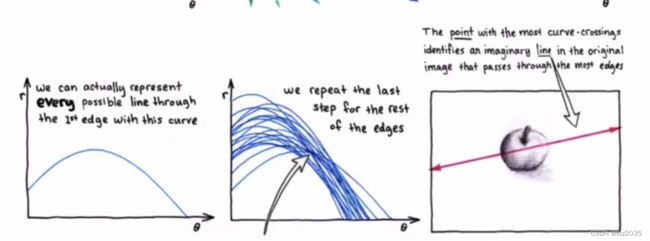
2.1代码实现
import cv2 as cv
import matplotlib.pyplot as plt
import numpy as np
from pylab import mpl
mpl.rcParams['font.sans-serif'] = ['SimHei']
img = cv.imread("line.png")
gray = cv.cvtColor(img,cv.COLOR_BGR2GRAY)
edges = cv.Canny(gray,50,150)
'''
50 和 150:Canny 边缘检测的阈值参数。这两个参数用于控制边缘的检测灵敏度
使用 cv.cvtColor() 函数将图像从 BGR 格式转换为灰度图像,并将结果存储在变量 gray 中。
再利用 cv.Canny() 函数对灰度图像进行边缘检测,得到边缘图像并将其存储在变量 edges 中
'''
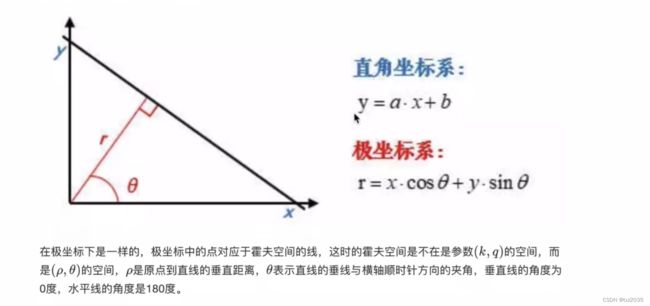
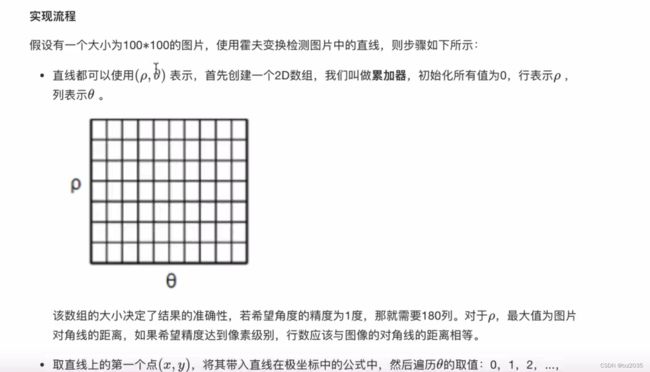
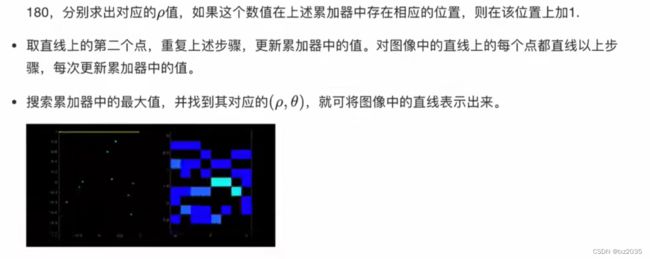
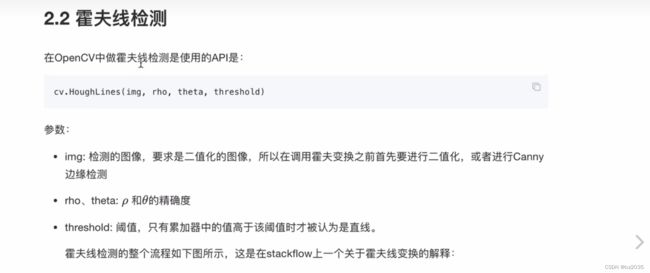
lines = cv.HoughLines(edges,0.8,np.pi / 180,150)
'''0.8:距离精度 rho 的值,表示极坐标距离 rho 的最小步长。
np.pi / 180:角度精度 theta 的值,表示极坐标角度 theta 的最小步长。
150:阈值,表示在霍夫空间中检测直线时所需的最低投票数。投票数高于阈值的直线将被认为是有效的直线。
'''
for line in lines:
rho,theta = line[00]
a = np.cos(theta)
b = np.sin(theta)
x0 = a * rho
y0 = b * rho
x1 = int(x0 + 1000 * (-b))
y1 = int(y0 + 1000 * (a))
x2 = int(x0 - 1000 * (-b))
y2 = int(y0 - 1000 *(a))
cv.line(img , (x1,y1),(x2,y2),(0,255,0))
'''遍历检测到的直线参数列表 lines。对于每条直线,首先获取直线的极坐标参数 rho 和 theta。
然后,根据极坐标中的角度 theta 计算出直线的斜率参数 a 和 b。
再根据极坐标中的距离 rho 计算出直线上的一对坐标 (x0, y0)。
接下来,利用斜率和距离计算直线上另外两个点的坐标 (x1, y1) 和 (x2, y2)。
最后,使用 cv.line() 函数在原始图像 img 上绘制检测到的直线,线段颜色为绿色。
'''
plt.figure(figsize=(5,4),dpi=100)
plt.imshow(img[:,:,::-1]),plt.title("霍夫变换线检测")
plt.xticks([]),plt.yticks([])
plt.show()
2.2结果展示
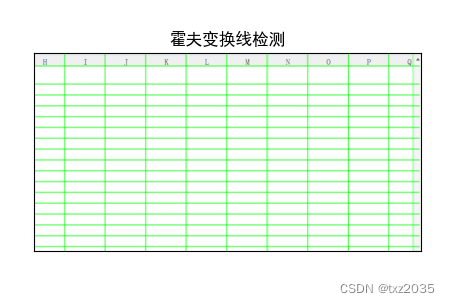
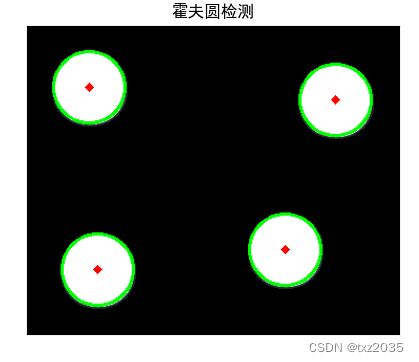
三,霍夫圆检测
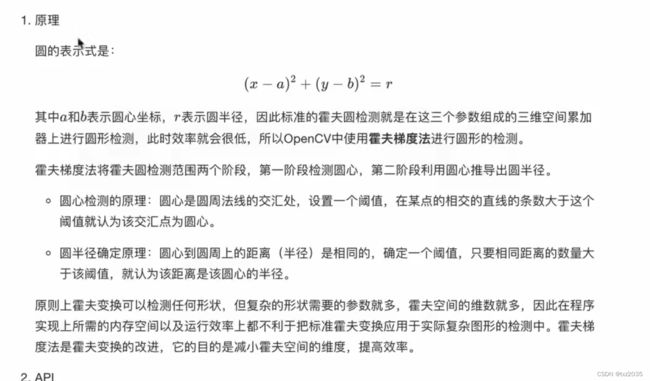


3.1代码实现
import cv2 as cv
import matplotlib.pyplot as plt
import numpy as np
from pylab import mpl
mpl.rcParams['font.sans-serif'] = ['SimHei']
planets = cv.imread("circle.png")
gray_img = cv.cvtColor(planets,cv.COLOR_BGR2GRAY)
img = cv.medianBlur(gray_img,7)
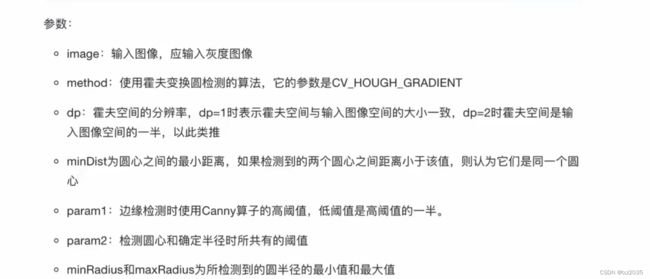
circles = cv.HoughCircles(img , cv.HOUGH_GRADIENT,1,200,param1=100,param2=30,minRadius=0,maxRadius=100)
if circles is not None:
for i in circles[0, :]:
cv.circle(planets, (i[0], i[1]), i[2], (0, 255, 0), 2)
cv.circle(planets, (i[0], i[1]), 2, (0, 0, 255), 3)
plt.figure(figsize=(5, 4), dpi=100)
plt.imshow(planets[:, :, ::-1])
plt.title("霍夫圆检测")
plt.xticks([])
plt.yticks([])
plt.show()
else:
print("未检测到圆")
3.2结果展示
