cocosCreator 之 Graphics绘制基础图形,五角星,线型图,柱形图
版本: 3.4.0
环境: Mac
Graphics组件
Graphics组件主要用于绘画使用,属于渲染组件。继承结构:
更多继承结构可参考: cocosCreator 之 cc.d.ts
该组件创建后,主要的属性有:
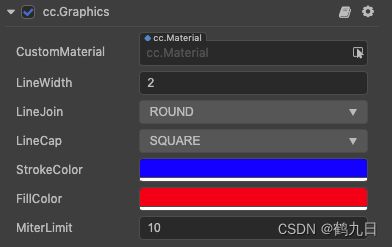
- LineWidth 线条宽度
- LineJoin 相交线段的拐角类型, 可通过
Graphics.LineJoin来设置,主要类型有:- BEVEL 斜角
- ROUND 圆角
- MITER 尖角
- LineCap 线条结束端点的样式, 可通过
Graphics.LineCap来设置, 主要类型有:- BUTT 向线条的每个末端添加平直的边缘
- ROUND 向线条的每个末端添加圆形线帽
- SQUARE 向线条的每个末端添加正方形线帽
- StrokeColor 画笔颜色
- FillColor 填充颜色,主要应用于图形的构建
- MiterLimit 最大斜接长度,默认即可
一个简答的示例:
// 绘制线段
//
export class UI_GraphicBaseLayer extends Component {
  // 绘制组件
  @property(Graphics) graphics: Graphics;

  start () {
    // 设置线段宽度
    this.graphics.lineWidth = 10;
    // 设置线段末端样式
    this.graphics.lineCap = Graphics.LineCap.ROUND;
    // 设置画笔颜色
    this.graphics.strokeColor = Color.RED;
    // 移动路径起点(x,y)
    this.graphics.moveTo(-400, 220);
    // 移动路径终点(x,y)
    this.graphics.lineTo(-200, 220);
    // 绘制
    this.graphics.stroke();
  }
}
通过moveTo和lineTo其实可以明白绘制一个从(-400, 200)到(-200, 200)的线段,这个是理解绘制的关键点。
该组件可以做很多事情:
- 用来绘制基础的线段,矩形,圆,椭圆等
- 用来绘制自定义的五角星,六角形,雷达图等
- 用来绘制折线图,圆柱图等
- 用来绘画涂鸦使用
- 用于同Mask遮罩进行自定义图形裁切,或者模拟刮刮乐效果等
注意:
使用Graphics组件绘制过多的图形或复杂的图形可能会导致性能下降,因为绘制操作需要消耗CPU和GPU资源。
特别是在移动设备等性能较低的设备上,过多的绘图操作可能会导致帧率下降,影响游戏的流畅度。
绘图接口
Graphics组件的主要属性和接口有:
| 名字 | 说明 |
|---|---|
| lineWidth | 设置/获取线条宽度 |
| lineJoin | 设置/获取两条线相交时,所创建的拐角类型,可通过Graphics.LineJoin设置 |
| lineCap | 设置/获取线条结束端点的样式, 可通过Graphics.LineCap来设置 |
| strokeColor | 设置/获取画笔颜色 |
| fillColor | 设置/获取填充颜色 |
| miterLimit | 设置/获取斜接面限制比例 |
| srcBlendFactor | 指定源的混合模式,这会克隆一个新材质对象,注意带来的性能和内存损耗 |
| dstBlendFactor | 指定目标的混合模式,这会克隆一个新材质对象,注意带来的性能和内存损耗 |
| moveTo() | 设置起始点(x, y) |
| lineTo() | 设置结束点(x, y) |
| quadraticCurveTo() | 绘制二次贝赛尔曲线 |
| bezierCurveTo() | 绘制三次贝赛尔曲线 |
| arc() | 绘制圆弧 |
| ellipse() | 绘制椭圆 |
| circle() | 绘制圆 |
| rect() | 绘制矩形 |
| roundRect() | 绘制圆角矩形 |
| fillRect() | 绘制填充矩形 |
| clear() | 擦除绘画 |
| close() | 将笔点返回到当前路径起始点的。它尝试从当前点到起始点绘制一条直线 |
| stroke() | 根据当前的画线样式,绘制当前或已经存在的路径 |
| fill() | 根据当前的画线样式,填充当前或已经存在的路径 |
具体的接口代码相关,参考:cc.d.ts
// 自定义图形类
export class Graphics extends Renderable2D {
	// 移动路径起点到坐标(x, y)
	moveTo(x: number, y: number): void;
	// 绘制直线路径(x,y)
	lineTo(x: number, y: number): void;
  /*
  * 绘制三次贝赛尔曲线路径。
  * @param c1x - 第一个控制点的坐标 x 轴。
  * @param c1y - 第一个控制点的坐标 y 轴。
  * @param c2x - 第二个控制点的坐标 x 轴。
  * @param c2y - 第二个控制点的坐标 y 轴。
  * @param x - 最后一个控制点的坐标 x 轴。
  * @param y - 最后一个控制点的坐标 y 轴。
  */
	bezierCurveTo(c1x:number, c1y:number, c2x:number, c2y:number, x:number, y: number): void;
	/**
  * 绘制二次贝赛尔曲线路径。
  * @param cx - 起始控制点的坐标 x 轴。
  * @param cy - 起始控制点的坐标 y 轴。
  * @param x - 终点控制点的坐标 x 轴。
  * @param y - 终点控制点的坐标 x 轴。
  */
	quadraticCurveTo(cx: number, cy: number, x: number, y: number): void;
	/**
  * 绘制圆弧路径。圆弧路径的圆心在 (cx, cy) 位置,半径为 r
  根据counterclockwise(默认false)指定的方向从startAngle开始绘制,到 endAngle 结束。
  * @param cx - 中心控制点的坐标 x 轴。
  * @param cy - 中心控制点的坐标 y 轴。
  * @param r - 圆弧弧度。
  * @param startAngle - 开始弧度,从正 x 轴顺时针方向测量。
  * @param endAngle - 结束弧度,从正 x 轴顺时针方向测量。
  * @param counterclockwise 如果为真,在两个角度之间逆时针绘制。默认顺时针。
  */
	arc(cx: number, cy: number, r: number, startAngle: number, endAngle: number, counterclockwise: boolean): void;
	/**
	* 绘制椭圆路径。
	* @param cx - 中心点的坐标 x 轴。
	* @param cy - 中心点的坐标 y 轴。
	* @param rx - 椭圆 x 轴半径。
	* @param ry - 椭圆 y 轴半径。
	*/
	ellipse(cx: number, cy: number, rx: number, ry: number): void;
	/**
	* 绘制圆形路径。
	* @param cx - 中心点的坐标 x 轴。
	* @param cy - 中心点的坐标 y 轴。
	* @param r - 圆半径。
	*/
	circle(cx: number, cy: number, r: number): void;
	/**
	* 绘制矩形路径。
	* @param x - 矩形起始坐标 x 轴。
	* @param y - 矩形起始坐标 y 轴。
	* @param w - 矩形宽度。
	* @param h - 矩形高度。
	*/
	rect(x: number, y: number, w: number, h: number): void;
	/**
	* 绘制圆角矩形路径。
	* @param x - 矩形起始坐标 x 轴。
	* @param y - 矩形起始坐标 y 轴。
	* @param w - 矩形宽度。
	* @param h - 矩形高度。
 	* @param r - 矩形圆角半径。
	*/
	roundRect(x: number, y: number, w: number, h: number, r: number): void;
	/**
	* 绘制填充矩形。
	* @param x - 矩形起始坐标 x 轴。
	* @param y - 矩形起始坐标 y 轴。
	* @param w - 矩形宽度。
	* @param h - 矩形高度。
	*/
	fillRect(x: any, y: any, w: any, h: any): void;
	// 擦除之前绘制的所有内容的方法
	clear(): void;
	// 将笔点返回到当前路径起始点的。它尝试从当前点到起始点绘制一条直线
	close(): void;
	// 根据当前的画线样式,绘制当前或已经存在的路径
	stroke(): void;
	// 根据当前的画线样式,填充当前或已经存在的路径
	fill(): void;
}
将这些代码从引擎提取粘贴了下,方便大家进行查阅。
下面将开始具体的示例相关,如果想在浏览器直观的显示出来,可以:
const { ccclass, property, executeInEditMode } = _decorator;
@executeInEditMode(true)			// 设置为true, 在编译器中模拟运行
绘制基础图形
主要绘制:
- 直线样式
- 点线样式
- 圆/椭圆/矩形/半圆
- 贝塞尔曲线
示例代码:
export class UI_GraphicBaseLayer extends Component {
  @property(Graphics) graphics: Graphics;

  start () {
    // 绘制直线
    this.drawLine();
    // 绘制点线
    this.drawStrokeLine();
    // 绘制图形
    this.drawGraph();
    // 绘制矩形
    this.drawRect();
    // 绘制贝塞尔曲线
    this.drawBezier();
  }

  // 绘制直线
  private drawLine() {
    // 设置线段宽度
    this.graphics.lineWidth = 10;
    // 设置线段末端样式
    this.graphics.lineCap = Graphics.LineCap.ROUND;
    // 设置画笔颜色
    this.graphics.strokeColor = Color.RED;
    // 移动路径起点
    this.graphics.moveTo(-400, 220);
    // 移动路径终点
    this.graphics.lineTo(-200, 220);
    // 绘制
    this.graphics.stroke();
    this.graphics.miterLimit = 10
  }

  // 绘制点线
  private drawStrokeLine() {
    this.graphics.strokeColor = Color.GREEN;
    this.graphics.lineWidth = 10;
    for (let i = 0; i < 5; i++) {
      this.graphics.moveTo(20 + i * 30, 220);
      this.graphics.lineTo(35 + i * 30, 220);
    }
    this.graphics.stroke();
  }

  // 绘制图形
  private drawGraph() {
    this.graphics.strokeColor = Color.BLUE;
    this.graphics.lineWidth = 10;
    this.graphics.lineCap = Graphics.LineCap.BUTT;
    // 矩形
    this.graphics.rect(250, 100, 100, 50);
    // 圆
    this.graphics.circle(-300, 100, 50);
    // 椭圆
    this.graphics.ellipse(-80, 100, 80, 40);
    // 部分圆
    this.graphics.arc(100, 100, 50, 0, Math.PI, true);

    this.graphics.fillColor = Color.BLACK;
    this.graphics.fill();
    this.graphics.stroke();
  }

  // 绘制矩形
  private drawRect() {
    this.graphics.strokeColor = Color.GREEN;
    this.graphics.lineWidth = 10;
    this.graphics.lineCap = Graphics.LineCap.BUTT;
    this.graphics.roundRect(250, -50, 150, 80, 20);
    // 设置填充颜色
    this.graphics.fillColor = Color.RED;
    // 填充
    this.graphics.fill();
    // 绘制
    this.graphics.stroke();
  }

  // 绘制贝塞尔曲线
  private drawBezier() {
    this.graphics.strokeColor = Color.MAGENTA;
    this.graphics.lineWidth = 3;
    this.graphics.moveTo(-300, -100);
    // 二次贝塞尔起点(-300,-100),结束点(-50,-100)
    this.graphics.quadraticCurveTo(-200, -200, -50, -50);

    // 上面是,下面是三次
    this.graphics.moveTo(0, -100);
    // 两个控制点 + 结束点, 三次贝塞尔
    this.graphics.bezierCurveTo(100, -200, 200, 0, 300, -100);
    this.graphics.stroke();
  }
}
示意图:

绘制星星
先看效果图:

主要实现代码:
@property(Graphics) graphics: Graphics;

start () {
  this.drawStar(-200, 100, 100, 40, 5);
  this.drawStar(50, 100, 100, 40, 6);
  this.drawStar(300, 100, 100, 40, 7);
}

private drawStar(x: number, y: number, r: number, cr: number, starNum:number, startAngle: number = -18) {
  this.graphics.fillColor = Color.YELLOW;
  this.graphics.strokeColor = Color.RED;
  this.graphics.lineWidth = 5;
  const angle = 360 / starNum;                // 平均角度
  for (let i = 0; i < starNum; i++) {
    if (i === 0) {
      // 首次要 moveTo
      this.graphics.moveTo(
        Math.cos(toRadian(startAngle)) * r + x,
        -Math.sin(toRadian(startAngle)) * r + y
      );
    } else {
      this.graphics.lineTo(
        Math.cos(toRadian(startAngle + i * angle)) * r + x,
        -Math.sin(toRadian(startAngle + i * angle)) * r + y
      );
    }
    this.graphics.lineTo(
      Math.cos(toRadian(startAngle + 36 + i * angle)) * cr + x,
      -Math.sin(toRadian(startAngle + 36 + i * angle)) * cr + y
    );
  }
  // 最后再连接至起始点
  this.graphics.close();
  this.graphics.fill();
  this.graphics.stroke();
}
绘制线型图
先看下效果图:

它的组成主要是:
- 行列线作为背景, 在实际的项目中,针对于行列线会使用图片代替,美观且性能高
- 数值标记, 比如列数值,行索引
- 折线图线段, 两点之间连线组成
这种效果,我们需要配置一些数据:
const ORIGIN_POS = new Vec2(-400, -220);            // 原点位置
const LINE_LEN = 800;                               // 行线段长度
const LINE_SPACE = 50;                              // 行间距
const COL_SAPACE = 60;                              // 列间距
const MAX_LINE = 10;                                // 最大行列数
const MAX_VAULE = 450;                              // 最大数值
通过原点位置,行列间距可以计算行的起始位置和行文本的位置
通过行线段长度和原点位置可以计算出线段结束位置,并绘制行线段
通过最大数值、最大行列数,可以计算出当前点的位置
因此行列背景和数值标记的示例代码如下:
export class UI_GraphicBrokenLineLayer extends Component {
  @property(Graphics) graphics: Graphics;                 // 绘图节点
  @property(Node) labelParent: Node;                      // 标签父节点

  start() {
    this.graphics.clear();
    this.labelParent.removeAllChildren();

    this.initBrokenLine();
  }

  // 初始化折线图背景
  private initBrokenLine() {
    // 初始化背景
    for(let i = 0; i < 10; ++i) {
      this.graphics.lineWidth = 4;
      this.graphics.strokeColor = Color.BLUE;
      this.graphics.moveTo(ORIGIN_POS.x, ORIGIN_POS.y + i * LINE_SPACE);
      this.graphics.lineTo(ORIGIN_POS.x + LINE_LEN, ORIGIN_POS.y + i * LINE_SPACE);
      this.graphics.stroke();
    }

    // 初始化标记文本
    for (let i = 0; i < 2; ++i) {
      for (let j = 0; j < 10; j++) {
        const labelNode = new Node("label");
        labelNode.parent = this.labelParent;
        const label = labelNode.addComponent(Label);
        label.fontSize = 20;
        label.lineHeight = 20;
        if (i === 0) {
          // 行
          const posY = (j !== 0) ? ORIGIN_POS.y  + j * LINE_SPACE : ORIGIN_POS.y  + j * LINE_SPACE - 10;
          labelNode.setPosition(v3(ORIGIN_POS.x - 30, posY, 0));
          label.string = (0 + j * 50).toString();
        } else {
          // 列(第一列不显示数字)
          labelNode.setPosition(v3(ORIGIN_POS.x + (j * COL_SAPACE), ORIGIN_POS.y - 30, 0));
          const content = (j === 0) ? "" : j.toString();
          label.string = content;
        }
      }
    }
  }
关于折线图的显示, 为了更直观,采用的是随机数值获取,并可被50整除,代码处理:
// 获取随机数值
private getRandValues(): number[] {
  const min = 0;
  const max = MAX_VAULE
  const values: number[] = [];
  for (let i = 0; i < MAX_LINE; ++i) {
    let value = Math.floor(Math.random() * (max - min + 1)) + min;
    value = Math.floor(value / 50) * 50;
    values.push(value);
  }

  return values;
}
根据每个数值需要计算点的位置,计算公式:
- 点的位置 = 原始位置 + 点的宽度/高度
- 点的宽度 = 当前数值/最大数值 * 最大长度
// 获取位置
private getPointPos(values: number[]): Vec2[] {
  const poses: Vec2[] = [];
  const maxColLen = (MAX_LINE - 1) * LINE_SPACE;
  for (let i = 0; i < MAX_LINE; ++i) {
    const curWidth = i * COL_SAPACE;
    const curHeight = values[i]/MAX_VAULE * maxColLen;
    const startPos = v2(ORIGIN_POS.x + curWidth, ORIGIN_POS.y + curHeight);
    poses.push(startPos);
  }
  return poses
}
最后绘制点的位置和两点之间连线
// 该接口在onStart中调用下即可
private drawBrokenLine() {
  // 获取随机数值
  const values = this.getRandValues();
  // 根据数值获取位置点
  const vecPos = this.getPointPos(values);

  // 绘制线
  for (let i = 0; i < values.length - 1; ++i) {
    const startPos = vecPos[i];
    const endPos = vecPos[i + 1];

    this.graphics.lineWidth = 4;
    this.graphics.strokeColor = Color.WHITE;
    this.graphics.lineJoin = Graphics.LineJoin.ROUND;
    this.graphics.lineCap = Graphics.LineCap.ROUND;
    this.graphics.moveTo(startPos.x, startPos.y);
    this.graphics.lineTo(endPos.x, endPos.y);
    this.graphics.stroke();
  }

  // 绘制点
  if (this._isShowPoint) {
    for (let i = 0; i < values.length; ++i) {
      const startPos = vecPos[i];
      this.graphics.lineWidth = 30;
      this.graphics.strokeColor = Color.RED;
      this.graphics.lineJoin = Graphics.LineJoin.ROUND;
      this.graphics.lineCap = Graphics.LineCap.ROUND;

      //
      this.graphics.circle(startPos.x, startPos.y, 10);
      this.graphics.fillColor = Color.RED;
      this.graphics.fill();
      this.graphics.moveTo(startPos.x, startPos.y);
      this.graphics.lineTo(startPos.x, startPos.y);
    }
  }
  this.graphics.stroke();
}
绘制圆柱图
先看下效果图:
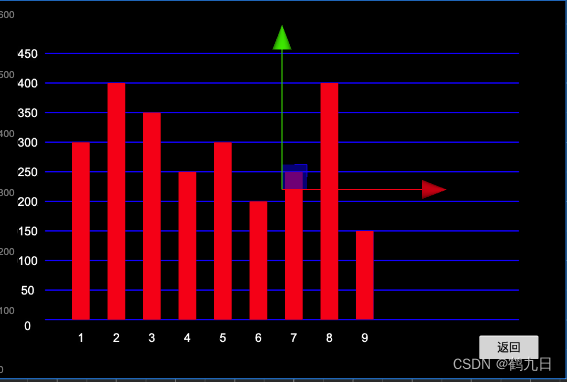
理解线型图后,圆柱图其实反而就容易了, 因为它的起始位置除了X轴都是固定的,我们需要计算:
最终Y位置 = 原点Y位置 + 当前高度即可, 主要代码实现:
// 绘制柱形图
private drawPill() {
  // 获取随机数值
  const values = this.getRandValues();
  console.log(values);
  // 根据数值获取位置点
  const maxColLen = (MAX_LINE - 1) * LINE_SPACE;

  // 绘制柱形
  for (let i = 1; i < values.length; ++i) {
    const height = values[i]/MAX_VAULE * maxColLen;
    if (height > 0) {
      const posX = ORIGIN_POS.x + (i - 0) * COL_SAPACE - 15;

      this.graphics.lineWidth = 2;
      this.graphics.lineJoin = Graphics.LineJoin.ROUND;
      this.graphics.lineCap = Graphics.LineCap.SQUARE;
      this.graphics.rect(posX, ORIGIN_POS.y, 30, height);
      this.graphics.fillColor = Color.RED;
      this.graphics.fill();
    }

  }
  this.graphics.stroke();
}

// 获取随机数值
private getRandValues(): number[] {
  const min = 0;
  const max = MAX_VAULE
  const values: number[] = [];
  for (let i = 0; i < MAX_LINE; ++i) {
    let value = Math.floor(Math.random() * (max - min + 1)) + min;
    value = Math.floor(value / 50) * 50;
    values.push(value);
  }

  return values;
}
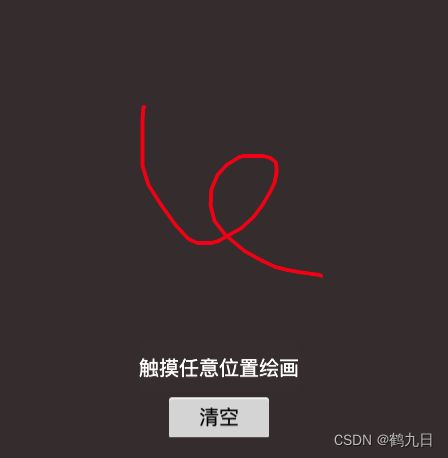
涂鸦
涂鸦的实现,需要通过触摸点获取位置相关,进行绘画,因此主要逻辑是:
@property(Graphics) graphics_2: Graphics;           // 涂鸦绘图

protected onEnable(): void {
  this.graphics_2.node.on(Node.EventType.TOUCH_START, this.touchStartEvent, this);
	this.graphics_2.node.on(Node.EventType.TOUCH_MOVE, this.touchMoveEvent, this);
}

protected onDisable(): void {
  this.graphics_2.node.off(Node.EventType.TOUCH_START, this.touchStartEvent, this);
	this.graphics_2.node.off(Node.EventType.TOUCH_MOVE, this.touchMoveEvent, this);
}

private touchStartEvent(event: EventTouch) {
  const pos = event.getUILocation();
  const transform = this.node.getComponent(UITransform);
  const out = transform.convertToNodeSpaceAR(v3(pos.x, pos.y, 0));
  this.graphics_2.moveTo(out.x, out.y);
}

private touchMoveEvent(event: EventTouch) {
  const pos = event.getUILocation();
  const transform = this.node.getComponent(UITransform);
  const out = transform.convertToNodeSpaceAR(v3(pos.x, pos.y, 0));
  this.graphics_2.lineTo(out.x, out.y);
  this.graphics_2.stroke();
  this.graphics_2.moveTo(out.x, out.y);
}

// 点击清空
public clickClearEvent() {
  this.graphics_2.clear();
}
效果图:
其他
更多示例代码可参考Gitee UIExample

本篇博客的编写,参考了:kuokuo分享的技术博客
在这里感谢作者的分享,祝大家生活开心!