2-线性回归之多变量线性回归基本原理的python实现
文章目录
- 多变量线性回归基本原理的python实现
-
- 1数据读取
- 2特征及标签获取
- 3参数及超参数设置
- 4使用梯度下降进行拟合
- 5拟合结果查看
- 6不同学习率下的拟合情况
- 参考文章
多变量线性回归基本原理的python实现
接续上一篇文章(https://blog.csdn.net/colleges/article/details/124765198)
1数据读取
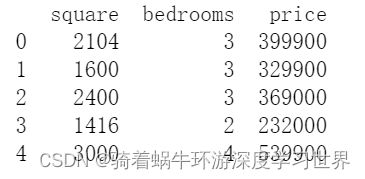
- 读取多变量线性回归数据集,是一个有两个特征的数据集:
# 多变量线性回归
raw_data = pd.read_csv('ex1data2.txt', names=['square', 'bedrooms', 'price'])
print(raw_data.head())
# 结果如下图所示
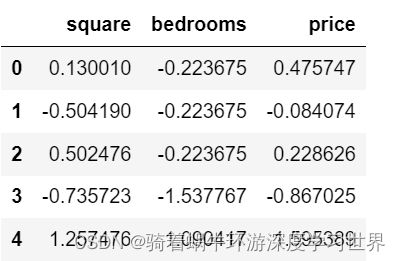
- 由于两个特征的量纲不一样,因此需要进行归一化。此处采用z-score归一化方法(使用均值和方差进行归一化),并对特征和标签值一起标准化:
# 此处采用z-score归一化方法
def normalize_feature(df):
#     """Applies function along input axis(default 0) of DataFrame."""
    return df.apply(lambda column: (column - column.mean()) / column.std())
- 对数据集进行标准化:
# 实际数据规范化结果
data = normalize_feature(raw_data)
data.head()
# 结果如下:
2特征及标签获取
- 使用上一节定义的获取标签和特征的函数获取该数据集的两个特征以及标签:
## 上一节定义的获取标签和特征的函数
# 读取特征
def get_X(df):
# """
# use concat to add intercept term to avoid side effect
# not efficient for big dataset though
# """
ones = pd.DataFrame({'ones': np.ones(len(df))}) # ones是m行1列的dataframe
data = pd.concat([ones, df], axis=1) # 合并数据,根据列合并
return data.iloc[:, :-1].values # 这个操作获取所有的特征列,返回 ndarray,不是矩阵
# 读取标签
def get_y(df):
# """
# assume the last column is the target
#
# """
return np.array(df.iloc[:, -1]) # df.iloc[:, -1]是指df的最后一列
## 获取本数据集的标签以及特征
X = get_X(data)
print(X.shape, type(X))
y = get_y(data)
print(y.shape, type(y)) # 看下数据的维度和类型
# 结果如下(在获取特征的时候已经构造了截距项):
# (47, 3) 3参数及超参数设置
- 构造参数向量,以及训练轮数和学习率:
alpha = 0.01 # 学习率
theta = np.zeros(X.shape[1]) # X.shape[1]:特征数n
epoch = 500 # 轮数
4使用梯度下降进行拟合
- 相关函数已经在上一节进行了详细的讲解,这边直接用即可:
## 上一节定义的两个用于梯度下降的函数
# 先定义函数来计算梯度下降更新公式中的求和部分
def gradient(theta, X, y):
    '''
    :param theta: 维度是R(n),是线性回归的参数
    :param X: 维度是R(m*n),m为样本数,n为特征数
    :param y: 维度是R(m)
    :return:维度是R(n+1,1),即与参数向量theta同维度
    '''
    m = X.shape[0]
    inner = np.dot(X.T, (np.dot(X, theta) - y))

    return inner / m
# 批量梯度下降函数
def batch_gradient_decent(theta, X, y, epoch, alpha=0.01):
    '''
    :param theta: 维度是R(n),是线性回归的参数
    :param X: 维度是R(m*n),m为样本数,n为特征数
    :param y: 维度是R(m)
    :param epoch: 批处理的轮数
    :param alpha: 学习率,即梯度下降更新公式里的alpha
    :return: 拟合线性回归,返回参数和代价
    '''
    cost_data = [lr_cost(theta, X, y)]
    _theta = theta.copy()  # 拷贝一份,不和原来的theta混淆

    for _ in range(epoch):
        _theta = _theta - alpha * gradient(_theta, X, y)
        cost_data.append(lr_cost(_theta, X, y))

    return _theta, cost_data
## 这一节直接进行拟合即可
final_theta, cost_data = batch_gradient_decent(theta, X, y, epoch, alpha=alpha)
5拟合结果查看
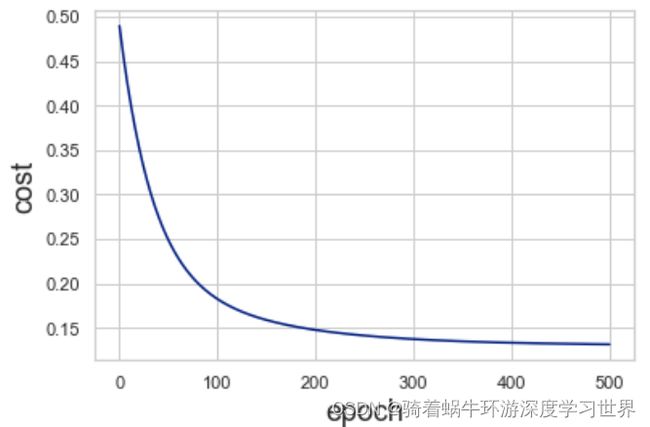
- 查看拟合过程中代价函数的值的变化:
sns.lineplot(x=np.arange(len(cost_data)), y = cost_data)
plt.xlabel('epoch', fontsize=18)
plt.ylabel('cost', fontsize=18)
plt.show()
# 结果如下所示:
- 查看最终的参数向量值(由于特征超过两个,就无法用二维平面图来直观查看拟合的曲线了):
print(final_theta)
# 结果如下
[ -1.14128565e-16   8.30383883e-01   8.23982853e-04]
6不同学习率下的拟合情况
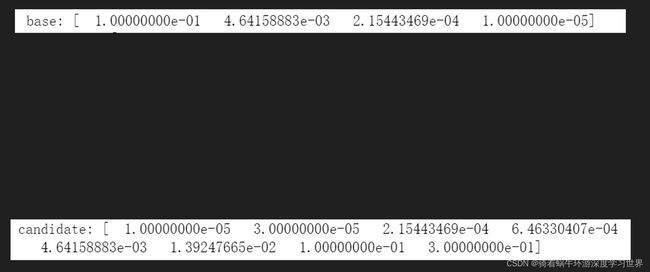
- 生成学习率序列:
# 产生不同的学习率
base = np.logspace(-1, -5, num=4) #指定起始及结束值,并指定个数,默认以10为底。该方法的详细用法见参考文章
print(base)
candidate = np.sort(np.concatenate((base, base*3)))
print(candidate)
# 结果如下
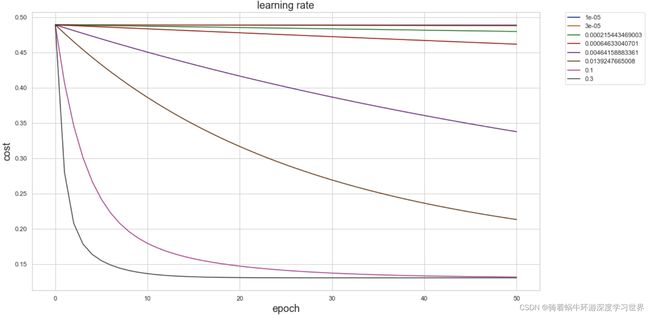
- 使用生成的学习率进行拟合,并绘图查看:
epoch=50

fig, ax = plt.subplots(figsize=(16, 9)) # 生成画布
# 遍历每一个学习率
for alpha in candidate:
    # 使用当前学习率拟合数据,计算迭代过程中的代价值
    _, cost_data = batch_gradient_decent(theta, X, y, epoch, alpha=alpha)
    # 绘制当前学习率之下的代价值的变化情况
    ax.plot(np.arange(epoch+1), cost_data, label=alpha)

ax.set_xlabel('epoch', fontsize=18)
ax.set_ylabel('cost', fontsize=18)
ax.legend(bbox_to_anchor=(1.05, 1), loc=2, borderaxespad=0.)
ax.set_title('learning rate', fontsize=18)
plt.show()
# 结果如下:
- 由图可知,最下面的一条曲线拟合的最好,因此可以用它对应的学习率来做最终的拟合。
参考文章
np.logspace()函数_好鱼知世界的博客-CSDN博客
