docker-compose安装ELK7.12.0并启用x-pack及kibana设置日志报警
- ELK Stack 简介
ELK 是三个开源软件的缩写,分别为:Elasticsearch、Logstash 以及 Kibana,它们都是开源软件。不过现在还新增了一个 Beats,它是一个轻量级的日志收集处理工具(Agent),Beats 占用资源少,适合于在各个服务器上搜集日志后传输给 Logstash,官方也推荐此工具,目前由于原本的 ELK Stack 成员中加入了 Beats 工具所以已改名为 Elastic Stack。
Elastic Stack 包含:
- Elasticsearch是个开源分布式搜索引擎,提供搜集、分析、存储数据三大功能。它的特点有:分布式,零配置,自动发现,索引自动分片,索引副本机制,restful
风格接口,多数据源,自动搜索负载等。详细可参考 Elasticsearch 权威指南 - Logstash 主要是用来日志的搜集、分析、过滤日志的工具,支持大量的数据获取方式。一般工作方式为 c/s 架构,client
端安装在需要收集日志的主机上,server 端负责将收到的各节点日志进行过滤、修改等操作在一并发往 Elasticsearch 上去。 - Kibana 也是一个开源和免费的工具,Kibana 可以为 Logstash 和 ElasticSearch 提供的日志分析友好的 Web 界面,可以帮助汇总、分析和搜索重要数据日志。
- Beats 在这里是一个轻量级日志采集器,其实 Beats 家族有 6 个成员,早期的 ELK 架构中使用 Logstash收集、解析日志,但是 Logstash 对内存、cpu、io 等资源消耗比较高。相比 Logstash,Beats 所占系统的 CPU和内存几乎可以忽略不计。
ELK Stack (5.0版本之后)–> Elastic Stack == (ELK Stack + Beats)。
目前 Beats 包含六种工具:
- Packetbeat: 网络数据(收集网络流量数据)
- Metricbeat: 指标(收集系统、进程和文件系统级别的 CPU 和内存使用情况等数据)
- Filebeat: 日志文件(收集文件数据)
- Winlogbeat: windows 事件日志(收集 Windows 事件日志数据)
- Auditbeat:审计数据(收集审计日志)
- Heartbeat:运行时间监控(收集系统运行时的数据)
k8s的filebeat配置文件地址/home/k8s_filebeat
ip(uat-192.168.180.37,prd-192.168.192.10)
现部署地址192.168.181.52:/home/stack_elk
前提:
- 1、数据来源于redis中的数据(filebeat推送到redis中)
- 2、centos7、Docker version 18.03.1-ce
一、创建以下compose和配置文件(es+kibana),传输层配置传输层安全性(TLS)加密
1、(基础文件准备开始)创建instances.yml 标识您需要为其创建证书的实例。
instances:
  - name: es01
    dns:
      - es01
      - localhost
    ip:
      - 192.168.181.52

  - name: 'kib01'
    dns:
      - kib01
      - localhost
2、创建create-certs.yml 用来生成Elasticsearch和Kibana的证书。
version: '2'

services:
  create_certs:
    image: docker.elastic.co/elasticsearch/elasticsearch:7.12.0
    #image: elk_es:v1
    container_name: create_certs
    command: >
      bash -c '
        yum install -y -q -e 0 unzip;
        if [[ ! -f /certs/bundle.zip ]]; then
          bin/elasticsearch-certutil cert --silent --pem --in config/certificates/instances.yml -out /certs/bundle.zip;
          unzip /certs/bundle.zip -d /certs;
        fi;
        chown -R 1000:0 /certs
      '
    working_dir: /usr/share/elasticsearch
    volumes:
      #- certs:/certs
      - ./certs:/certs
      - .:/usr/share/elasticsearch/config/certificates
    networks:
      - elastic

#volumes:
#  certs:
#    driver: local

networks:
  elastic:
    driver: bridge
3、创建单节点es配置elastic-docker-tls.yml
其中包含单节点的Elasticsearch和一个启用了TLS的Kibana实例和一个logstash实例。
version: '2.1'
services:
  es01:
    image: docker.elastic.co/elasticsearch/elasticsearch:7.12.0
    container_name: es01
    restart: always
    environment:
      - "discovery.type=single-node"
      - "ES_JAVA_OPTS=-Xms2048m -Xmx2048m"
      # 生成并应用支持传输层安全性的试用许可证。
      - xpack.license.self_generated.type=trial
      - xpack.security.enabled=true
      # 启用传输层安全性以加密客户端通信。
      - xpack.security.http.ssl.enabled=true
      - xpack.security.http.ssl.key=/usr/share/elasticsearch/config/certificates/es01/es01.key
      - xpack.security.http.ssl.certificate_authorities=/usr/share/elasticsearch/config/certificates/ca/ca.crt
      - xpack.security.http.ssl.certificate=/usr/share/elasticsearch/config/certificates/es01/es01.crt
      # 启用传输层安全性以加密节点间通信。
      - xpack.security.transport.ssl.enabled=true
      # 通过不需要主机名验证来允许使用自签名证书。
      - xpack.security.transport.ssl.verification_mode=certificate
      - xpack.security.transport.ssl.certificate_authorities=/usr/share/elasticsearch/config/certificates/ca/ca.crt
      - xpack.security.transport.ssl.certificate=/usr/share/elasticsearch/config/certificates/es01/es01.crt
      - xpack.security.transport.ssl.key=/usr/share/elasticsearch/config/certificates/es01/es01.key
      - "http.cors.enabled=true"
      - "http.cors.allow-origin=*"
      - "http.cors.allow-headers=Authorization,X-Requested-With,Content-Length,Content-Type"
    ulimits:
      memlock:
        soft: -1
        hard: -1
    volumes:
      - ./data01:/usr/share/elasticsearch/data
      - ./certs:/usr/share/elasticsearch/config/certificates
    ports:
      - 9200:9200
    networks:
      - elastic
    healthcheck:
      test: curl --cacert /usr/share/elasticsearch/config/certificates/ca/ca.crt -s https://localhost:9200 >/dev/null; if [[ $$? == 52 ]]; then echo 0; else echo 1; fi
      # 每次检查之间的间隔时间
      interval: 30s
      # 运行命令的超时时间
      timeout: 10s
      # 重试次数
      retries: 5

  es-head:
    image: mobz/elasticsearch-head:5
    container_name: elasticsearch-head
    restart: always
    ports:
      - 9100:9100

  kib01:
    image: docker.elastic.co/kibana/kibana:7.12.0
    container_name: kib01
    restart: always
    depends_on: {"es01": {"condition": "service_healthy"}}
    ports:
      - 5601:5601
    environment:
      SERVERNAME: localhost
      ELASTICSEARCH_URL: https://es01:9200
      ELASTICSEARCH_HOSTS: https://es01:9200
      ELASTICSEARCH_USERNAME: kibana_system
      ELASTICSEARCH_PASSWORD: n3nhaKiYczkls3AoXup6
      ELASTICSEARCH_SSL_CERTIFICATEAUTHORITIES: /usr/share/elasticsearch/config/certificates/ca/ca.crt
      SERVER_SSL_ENABLED: "true"
      SERVER_SSL_KEY: /usr/share/elasticsearch/config/certificates/kib01/kib01.key
      SERVER_SSL_CERTIFICATE: /usr/share/elasticsearch/config/certificates/kib01/kib01.crt
    volumes:
      - ./certs:/usr/share/elasticsearch/config/certificates
      - ./kibana.yml:/usr/share/kibana/config/kibana.yml
    networks:
      - elastic

networks:
  elastic:
    driver: bridge
①kibana配置插件logtrail(如不需要此插件可以跳过①②③)
cd images/kibana/
下载对应的logtrail插件包:
wget https://github.com/sivasamyk/logtrail/releases/download/v0.1.31/logtrail-7.9.1-0.1.31.zip
②創建kibana的Dockerfile
FROM docker.elastic.co/kibana/kibana:7.9.1
ADD ./logtrail-7.9.1-0.1.31.zip /opt/kibana/plugins/logtrail-7.9.1-0.1.3
RUN ./bin/kibana-plugin install file:///opt/kibana/plugins//logtrail-7.9.1-0.1.31.zip
③(基础文件准备结束)配置logtrail显示规则(logtrail.json)
cat logtrail.json
{
    "version": 2,
    "index_patterns": [{
        "es": {
            "default_index": "prod-*",
            "allow_url_parameter": false,
            "timezone": "UTC"
        },
        "tail_interval_in_seconds": 10,
        "es_index_time_offset_in_seconds": 0,
        "display_timezone": "local",
        "display_timestamp_format": "YYYY年MM月DD日 HH:mm:ss",
        "max_buckets": 500,
        "nested_objects": false,
        "default_time_range_in_days": 5,
        "max_hosts": 100,
        "max_events_to_keep_in_viewer": 5000,
        "default_search": "",
        "fields": {
            "mapping": {
                "timestamp": "@timestamp",
                "program": "tags",
                "hostname": "kubernetes.labels.name",
                "message": "message"
            },
            "hostname_format": "{{{kubernetes.namespace}}} | {{{hostname}}}",
            "message_format": "{{{kubernetes.namespace}}} | {{{message}}}",
            "keyword_suffix": "keyword"
        }
    },{
        "es": {
            "default_index": "uat-*",
            "allow_url_parameter": false,
            "timezone": "UTC"
        },
        "tail_interval_in_seconds": 10,
        "es_index_time_offset_in_seconds": 0,
        "display_timezone": "local",
        "display_timestamp_format": "YYYY年MM月DD日 HH:mm:ss",
        "max_buckets": 500,
        "nested_objects": false,
        "default_time_range_in_days": 5,
        "max_hosts": 100,
        "max_events_to_keep_in_viewer": 5000,
        "default_search": "",
        "fields": {
            "mapping": {
                "timestamp": "@timestamp",
                "program": "tags",
                "hostname": "kubernetes.labels.name",
                "message": "message"
            },
            "hostname_format": "{{{kubernetes.namespace}}} | {{{hostname}}}",
            "message_format": "{{{kubernetes.namespace}}} | {{{message}}}",
            "keyword_suffix": "keyword"
        }
    },{
        "es": {
            "default_index": "st-*",
            "allow_url_parameter": false,
            "timezone": "UTC"
        },
        "tail_interval_in_seconds": 10,
        "es_index_time_offset_in_seconds": 0,
        "display_timezone": "local",
        "display_timestamp_format": "YYYY年MM月DD日 HH:mm:ss",
        "max_buckets": 500,
        "nested_objects": false,
        "default_time_range_in_days": 5,
        "max_hosts": 100,
        "max_events_to_keep_in_viewer": 5000,
        "default_search": "",
        "fields": {
            "mapping": {
                "timestamp": "@timestamp",
                "program": "tags",
                "hostname": "attrs.service",
                "message": "log"
            },
            "message_format": "{{{log}}} | {{{marker}}}",
            "keyword_suffix": "keyword"
        }
    }]
}
1.1、(开始)通过启动create-certs容器为Elasticsearch生成证书:
[root@dev23 stack_elk]# docker-compose -f create-certs.yml run --rm create_certs
1.2、建立单节点的Elasticsearch集群:
[root@dev23 stack_elk]# mkdir data01
[root@dev23 stack_elk]# chmod 777 data01
[root@dev23 stack_elk]# docker-compose -f elastic-docker-tls.yml up -d es01
1.3、运行该elasticsearch-setup-passwords工具为所有内置用户(包括该kibana_system用户)生成密码,自动生成密码用auto, 自己设置用 interactive。
[root@dev23 stack_elk]# docker exec es01 /bin/bash -c "bin/elasticsearch-setup-passwords auto --batch --url https://es01:9200"

#为elastic用户设置密码后,引导密码将不再有效。并且再次执行elasticsearch-setup-passwords命令会抛出异常
Failed to authenticate user 'elastic' against https://es01:9200/_security/_authenticate?pretty
Possible causes include:
 * The password for the 'elastic' user has already been changed on this cluster
 * Your elasticsearch node is running against a different keystore
   This tool used the keystore at /usr/share/elasticsearch/config/elasticsearch.keystore

ERROR: Failed to verify bootstrap password
1.4、ELASTICSEARCH_PASSWORD在kibana-docker.yml撰写文件中设置为kibana_system用户生成的密码。
  kib01:
    image: docker.elastic.co/kibana/kibana:${VERSION}
    container_name: kib01
    depends_on: {"es01": {"condition": "service_healthy"}}
    ports:
      - 5601:5601
    environment:
      SERVERNAME: localhost
      ELASTICSEARCH_URL: https://es01:9200
      ELASTICSEARCH_HOSTS: https://es01:9200
      ELASTICSEARCH_USERNAME: kibana_system
      # 修改此处的密码
      ELASTICSEARCH_PASSWORD: CHANGEME
      ...
1.5、使用docker-compose重启es和Kibana:
[root@dev23 stack_elk]# docker-compose -f elastic-docker-tls.yml up -d
1.6、访问kibana《https://192.168.181.52:5601》
使用elastic用户登录kibana
二、配置 Logstash 启用 TLS连接es
cd logstash/
以下配置文件中涉及到用户名和密码需要引用1.3步骤中所生成的密码
2.1、配置Logstash的docker-compose.yml
version: '2'
services:
  logstash:
    container_name: logstash
    #image: logstash_elk:v1
    image: logstash:7.12.0
    restart: always
    ports:
    - 5044:5044
    volumes:
    - ./config/logstash.conf:/usr/share/logstash/pipeline/logstash.conf
    - ./config/logstash.yml:/usr/share/logstash/config/logstash.yml
    - ../certs/ca/:/etc/logstash/config/certs/
2.2、创建配置文件logstash.conf
cat config/logstash.conf
input {
  redis {
      host => "192.168.181.18"
      port => "6379"
      password => "sinoeyes"
      key => "sinoeyes-io"
      data_type => "list"
      db => "5"
  }
}

filter {
    grok {
        match => { "message" => "%{TIMESTAMP_ISO8601:log_date}\s*(?([\S+]*))\s*(?([\S+]*))\s*%{LOGLEVEL:log_level}" }
    }

}


output {
    elasticsearch {
        hosts => "192.168.181.52:9200"
        index => "%{tags}-%{+YYYY.MM.dd}"
        ssl => true
        user => "elastic"
        password => "W7ZOoGqxdncD5IyLSeKX"
        ssl => true
        cacert => '/etc/logstash/config/certs/ca.crt'
    }
}
2.3、创建Logstash的配置文件
cat config/logstash.yml
# Settings file in YAML
#
# Settings can be specified either in hierarchical form, e.g.:
#
# pipeline:
# batch:
# size: 125
# delay: 5
#
# Or as flat keys:
#
# pipeline.batch.size: 125
# pipeline.batch.delay: 5
#
# ------------ Node identity ------------
#
# Use a descriptive name for the node:
#
# node.name: test
#
# If omitted the node name will default to the machine's host name
#
# ------------ Data path ------------------
#
# Which directory should be used by logstash and its plugins
# for any persistent needs. Defaults to LOGSTASH_HOME/data
#
# path.data:
#
# ------------ Pipeline Settings --------------
#
# The ID of the pipeline.
#
# pipeline.id: main
#
# Set the number of workers that will, in parallel, execute the filters+outputs
# stage of the pipeline.
#
# This defaults to the number of the host's CPU cores.
#
# pipeline.workers: 2
#
# How many events to retrieve from inputs before sending to filters+workers
#
# pipeline.batch.size: 125
#
# How long to wait in milliseconds while polling for the next event
# before dispatching an undersized batch to filters+outputs
#
# pipeline.batch.delay: 50
#
# Force Logstash to exit during shutdown even if there are still inflight
# events in memory. By default, logstash will refuse to quit until all
# received events have been pushed to the outputs.
#
# WARNING: enabling this can lead to data loss during shutdown
#
# pipeline.unsafe_shutdown: false
#
# Set the pipeline event ordering. Options are "auto" (the default), "true" or "false".
# "auto" will automatically enable ordering if the 'pipeline.workers' setting
# is also set to '1'.
# "true" will enforce ordering on the pipeline and prevent logstash from starting
# if there are multiple workers.
# "false" will disable any extra processing necessary for preserving ordering.
#
pipeline.ordered: auto
#
# ------------ Pipeline Configuration Settings --------------
#
# Where to fetch the pipeline configuration for the main pipeline
#
# path.config:
#
# Pipeline configuration string for the main pipeline
#
# config.string:
#
# At startup, test if the configuration is valid and exit (dry run)
#
# config.test_and_exit: false
#
# Periodically check if the configuration has changed and reload the pipeline
# This can also be triggered manually through the SIGHUP signal
#
# config.reload.automatic: false
#
# How often to check if the pipeline configuration has changed (in seconds)
# Note that the unit value (s) is required. Values without a qualifier (e.g. 60)
# are treated as nanoseconds.
# Setting the interval this way is not recommended and might change in later versions.
#
# config.reload.interval: 3s
#
# Show fully compiled configuration as debug log message
# NOTE: --log.level must be 'debug'
#
# config.debug: false
#
# When enabled, process escaped characters such as \n and \" in strings in the
# pipeline configuration files.
#
# config.support_escapes: false
#
# ------------ HTTP API Settings -------------
# Define settings related to the HTTP API here.
#
# The HTTP API is enabled by default. It can be disabled, but features that rely
# on it will not work as intended.
# http.enabled: true
#
# By default, the HTTP API is bound to only the host's local loopback interface,
# ensuring that it is not accessible to the rest of the network. Because the API
# includes neither authentication nor authorization and has not been hardened or
# tested for use as a publicly-reachable API, binding to publicly accessible IPs
# should be avoided where possible.
#
# http.host: 127.0.0.1
#
# The HTTP API web server will listen on an available port from the given range.
# Values can be specified as a single port (e.g., `9600`), or an inclusive range
# of ports (e.g., `9600-9700`).
#
# http.port: 9600-9700
#
# ------------ Module Settings ---------------
# Define modules here. Modules definitions must be defined as an array.
# The simple way to see this is to prepend each `name` with a `-`, and keep
# all associated variables under the `name` they are associated with, and
# above the next, like this:
#
# modules:
# - name: MODULE_NAME
# var.PLUGINTYPE1.PLUGINNAME1.KEY1: VALUE
# var.PLUGINTYPE1.PLUGINNAME1.KEY2: VALUE
# var.PLUGINTYPE2.PLUGINNAME1.KEY1: VALUE
# var.PLUGINTYPE3.PLUGINNAME3.KEY1: VALUE
#
# Module variable names must be in the format of
#
# var.PLUGIN_TYPE.PLUGIN_NAME.KEY
#
# modules:
#
# ------------ Cloud Settings ---------------
# Define Elastic Cloud settings here.
# Format of cloud.id is a base64 value e.g. dXMtZWFzdC0xLmF3cy5mb3VuZC5pbyRub3RhcmVhbCRpZGVudGlmaWVy
# and it may have an label prefix e.g. staging:dXMtZ...
# This will overwrite 'var.elasticsearch.hosts' and 'var.kibana.host'
# cloud.id: :
# This is optional
# If supplied this will overwrite 'var.elasticsearch.username' and 'var.elasticsearch.password'
# If supplied this will overwrite 'var.kibana.username' and 'var.kibana.password'
# cloud.auth: elastic:2.4、启动
docker-compose up -d
Logstash 启用 TLS参考
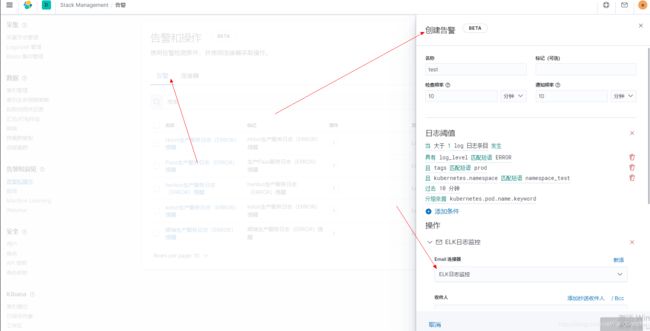
三、日志告警
1、创建连接器
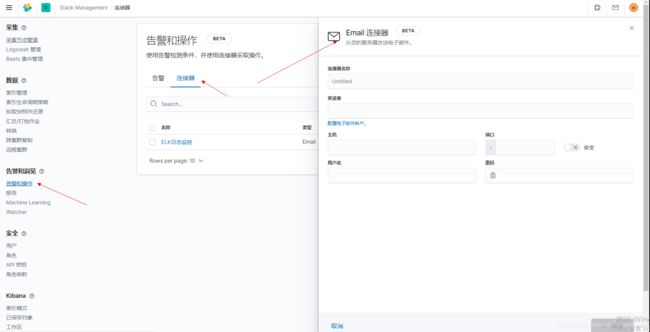
2、创建报警
每十分钟检查日志,如果检测到日志ERROR超过1个就发送邮件
定义警报参考
四、页面调整
5.1、Discover页面日志显示不全
解决办法:
高级设置页面truncate:maxHeight 这个属性指定了表格中单元格显示时占用的最大高度,设置为0则不限制。

高级设置所有字段参考
五、定时删除日志
#/bin/bash
#es-index-clear
#只保留某几天内的日志索引-5 days || 5 days ago
ST_LAST_DATA=`date -d "-7 days" "+%Y.%m.%d"`
UAT_LAST_DATA=`date -d "-7 days" "+%Y.%m.%d"`
PROD_LAST_DATA=`date -d "-30 days" "+%Y.%m.%d"`

#删除上个月份所有的索引
curl --user elastic:passowrd -XDELETE "https://172.188.180.52:9200/st-${ST_LAST_DATA}" -k
#curl -XGET "https://172.188.180.52:9200/st-${ST_LAST_DATA}"
curl --user elastic:passowrd -XDELETE "https://172.188.180.52:9200/uat-paas-${UAT_LAST_DATA}" -k
#curl -XGET "https://172.188.180.52:9200/uat-dev15-${UAT_LAST_DATA}"
curl --user elastic:passowrd -XDELETE "https://172.188.180.52:9200/prod-admin-paas-${PROD_LAST_DATA}" -k
#curl -XGET "https://172.188.180.52:9200/prod-admin-paas-${PROD_LAST_DATA}"

#crontab -e添加定时任务:
#0 1 * * * /home/stack_elk/clear_index/es-index-clear.sh
-k 允许在没有证书的情况下连接到SSL站点
(官方参考)[https://www.elastic.co/guide/en/elastic-stack-get-started/7.9/get-started-docker.html#get-started-docker-tls]