GEE开发之Sentinel-2计算NDVI和数据分析
GEE开发之Sentinel-2计算NDVI和数据分析
- 1 基础知识
- 2 影像、数据、变化趋势实现
- 3 一年内所有影像数据查看和下载
-
- 3.1 NDVI值影像获取
- 3.2 原始影像获取
- 4 月平均数据的变化趋势
- 5 月平均影像数据的查看和下载
-
- 5.1 NDVI值影像获取
- 5.2 原始影像获取
前言:主要介绍哨兵2号卫星下计算NDVI的值、遥感影像和数据的获取。
1 基础知识
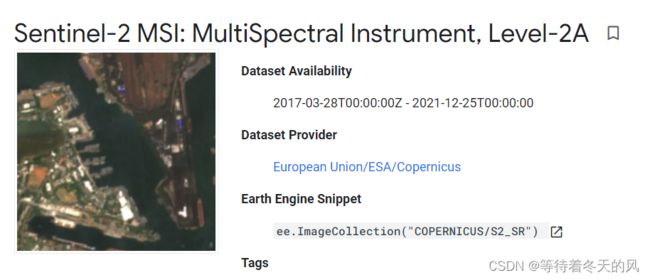
Sentinel-2:中文名哨兵2号卫星。
- Sentinel-2是一种宽测绘带、高分辨率、多光谱成像任务,支持哥白尼土地监测研究,包括植被、土壤和水覆盖的监测,以及内陆水道和沿海地区的观察。
- Sentinel-2 L2数据从scihub下载。它们是通过运行sen2cor计算的。警告:ESA没有为所有一级资产生成二级数据,早期的二级覆盖范围不是全局的。
- 这些资源包含12个UINT16光谱带,代表按10000缩放的SR(与L1数据不同,没有B10)。还有几个L2特定的频段(有关详细信息,请参阅频段列表)。有关详细信息,请参阅Sentinel-2用户手册。此外,存在三个QA频带,其中一个(QA60)是具有云掩码信息的位掩码频带。有关更多详细信息,请参阅如何计算云遮罩的完整解释。
- Sentinel-2 L2资产的EE资产ID具有以下格式:哥白尼/S2\U SR/20151128 002653\U 20151128 102149\U T56MNN。这里,第一个数字部分表示感应日期和时间,第二个数字部分代表产品生成日期和时间。最后一个6个字符的字符串是一个唯一的颗粒标识符,指示其UTM网格参考(请参阅MGRS)。
- COPERNICUS/S2:分辨率为10m
NDVI的计算公式:NDVI = (近红外波段 - 红波段) / (近红外波段 + 红波段)
针对每种卫星的波段,选用的波段都有所不同,公式如下:
- Landsat8: NDVI = (band5 - band4) / (band5 + band4)
- Sentinel2: NDVI = (band8 - band4) / (band8 + band4)
- Modis: NDVI = (band2 - band1) / (band2 + band1)
- ETM/TM: NDVI = (band4 - band3) / (band4 + band3)
- AVHRR: NDVI = (CH2 - CH1) / (CH2 + CH1)
2 影像、数据、变化趋势实现
代码如下(以鹿邑县为例)
注意:分辨率为10m
//以鹿邑县为例子
var geometry = ee.FeatureCollection('users/www1573979951/luyixian')
Map.centerObject(geometry,7)
//颜色设置
var colorizedVis = {
  min: -0.8,
  max: 0.8,
  palette: ['blue', 'white', 'green'],
};

//使用QA波段去云
function maskS2clouds(image) {
  var qa = image.select('QA60');
  // Bits 10 and 11 are clouds and cirrus, respectively.
  var cloudBitMask = 1 << 10;
  var cirrusBitMask = 1 << 11;
  // Both flags should be set to zero, indicating clear conditions.
  var mask = qa.bitwiseAnd(cloudBitMask).eq(0)
      .and(qa.bitwiseAnd(cirrusBitMask).eq(0));
  return image.updateMask(mask).divide(10000).set(image.toDictionary(image.propertyNames()));
}

//NDVI的计算公式
function createNDVI(image){
  var ndvi = image.normalizedDifference(["B8","B4"]).rename('NDVI');
  return image.addBands(ndvi);
}

//特别注意的是,在数学变换之后,保持原始影像的属性,所以这里.set(image.toDictionary(image.propertyNames()));
var S2_COL = ee.ImageCollection("COPERNICUS/S2")
.filterDate("2020-01-01", "2020-12-31")
.filter(ee.Filter.lt('CLOUDY_PIXEL_PERCENTAGE',20))
.filterBounds(geometry)
.map(maskS2clouds)
.map(createNDVI)
.select('NDVI');
print(S2_COL)
Map.addLayer(S2_COL.mean().clip(geometry), colorizedVis, 'col');

//趋势线代码
var S2_chart = ui.Chart.image.series({
    imageCollection: S2_COL.select('NDVI'),
    region: geometry,
    reducer: ee.Reducer.mean(),
    scale: 500
    }).setOptions({
      interpolateNulls: true,
      lineWidth: 2,
      title: 'NDVI Time Seires',
      vAxis: {title: 'NDVI'},
      hAxis: {title: 'Date'},
      trendlines: { 0: {title: 'NDVI_trend',type:'linear', showR2: true,  color:'red', visibleInLegend: true}}
    });
print(S2_chart);
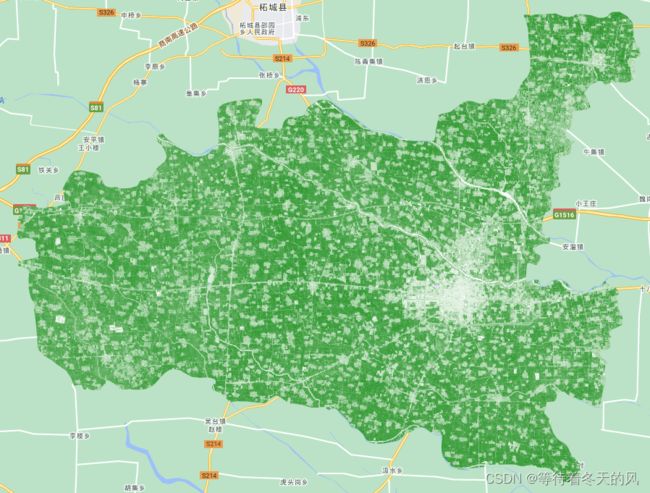
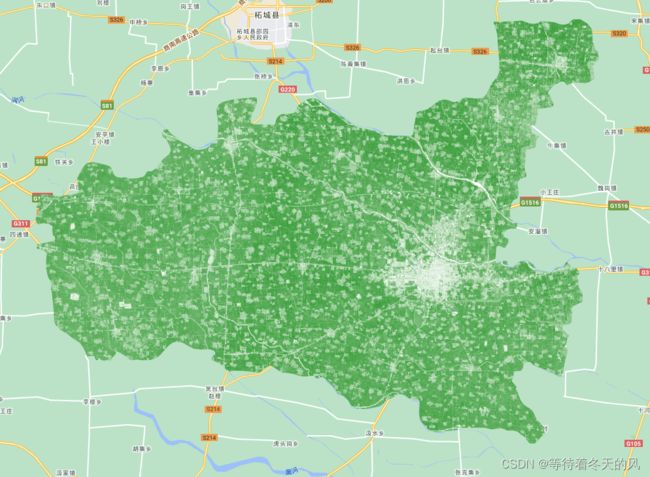
遥感影像截图:
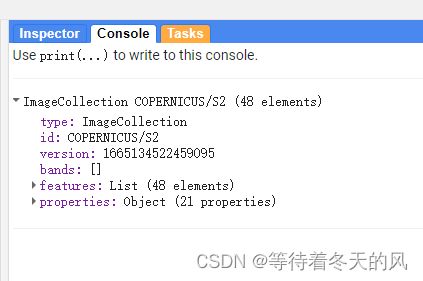
数据集截图(51个数据集):

表格数据以及变化趋势截图:

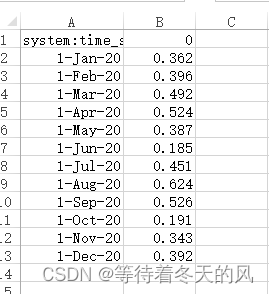
CSV数据:

3 一年内所有影像数据查看和下载
3.1 NDVI值影像获取
分辨率:10m
代码如下(以鹿邑县为例):
//以鹿邑县为例子
var geometry = ee.FeatureCollection('users/www1573979951/luyixian')
Map.centerObject(geometry,7)
//颜色设置
var colorizedVis = {
  min: -0.8,
  max: 0.8,
  palette: ['blue', 'white', 'green'],
};

//使用QA波段去云
function maskS2clouds(image) {
  var qa = image.select('QA60');
  // Bits 10 and 11 are clouds and cirrus, respectively.
  var cloudBitMask = 1 << 10;
  var cirrusBitMask = 1 << 11;
  // Both flags should be set to zero, indicating clear conditions.
  var mask = qa.bitwiseAnd(cloudBitMask).eq(0)
      .and(qa.bitwiseAnd(cirrusBitMask).eq(0));
  return image.updateMask(mask).divide(10000).set(image.toDictionary(image.propertyNames()));
}

//NDVI的计算公式
function createNDVI(image){
  var ndvi = image.normalizedDifference(["B8","B4"]).rename('NDVI');
  return image.addBands(ndvi);
}

//特别注意的是,在数学变换之后,保持原始影像的属性,所以这里.set(image.toDictionary(image.propertyNames()));
var S2_COL = ee.ImageCollection("COPERNICUS/S2")
.filterDate("2020-01-01", "2020-12-31")
.filter(ee.Filter.lt('CLOUDY_PIXEL_PERCENTAGE',20))
.filterBounds(geometry)
.map(maskS2clouds)
.map(createNDVI)
.select('NDVI');

// Map.addLayer(S2_COL.mean().clip(geometry), colorizedVis, 'col');

print(S2_COL)

function exportImageCollection(imgCol) {
  var indexList = imgCol.reduceColumns(ee.Reducer.toList(), ["system:index"]).get("list");
  indexList.evaluate(function(indexs) {
    for (var i=0; i<indexs.length; i++) {
      var image = imgCol.filter(ee.Filter.eq("system:index", indexs[i])).first();
      Map.addLayer(image.clip(geometry), colorizedVis, 'sentinel_10_ndvi_2020_'+indexs[i]);
       //tif数据下载
      Export.image.toDrive({
        image: image.clip(geometry),
        description: 'sentinel_10_ndvi_2020_'+indexs[i],
        fileNamePrefix: 'sentinel_10_ndvi_2020_'+indexs[i],
        folder: 'sentinel_10',
        region: geometry,
        scale: 10,
        crs: "EPSG:4326",
        maxPixels: 1e13
      });
    }
  });
}
exportImageCollection(S2_COL);
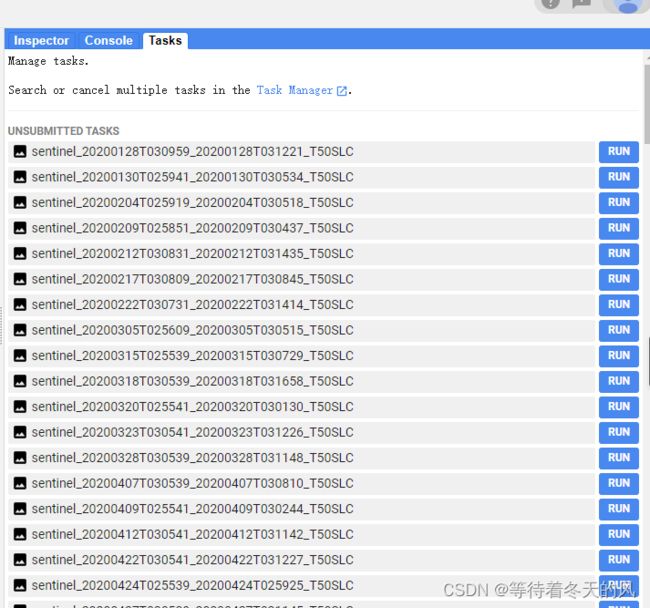
3.2 原始影像获取
分辨率:10m
代码如下(以鹿邑县为例):
var roi = ee.FeatureCollection('users/www1573979951/luyixian');;  //table为自己上传的矢量边界

//去云
function maskS2clouds(image) {
  var qa = image.select('QA60');
  // Bits 10 and 11 are clouds and cirrus, respectively.
  var cloudBitMask = 1 << 10;
  var cirrusBitMask = 1 << 11;
  // Both flags should be set to zero, indicating clear conditions.
  var mask = qa.bitwiseAnd(cloudBitMask).eq(0)
      .and(qa.bitwiseAnd(cirrusBitMask).eq(0));
  return image.updateMask(mask).divide(10000);
}

//按条件筛选影像
var dataset = ee.ImageCollection('COPERNICUS/S2')
                  .filterBounds(roi)
                  .filterDate('2020-01-01','2020-12-31')
                  .filter(ee.Filter.lt('CLOUDY_PIXEL_PERCENTAGE', 10))
                  .map(maskS2clouds);
print(dataset)

var rgbVis = {
  min: 0.0,
  max: 0.3,
  bands: ['B4', 'B3', 'B2'],
};

// Map.addLayer(dataset.mean().clip(roi), rgbVis, 'dataset');
Map.centerObject(roi,7)

//显示roi
var styling = {color:"red",fillColor:"00000000"};
Map.addLayer(roi.style(styling),{},"boundary")

function exportImageCollection(imgCol) {
  var indexList = imgCol.reduceColumns(ee.Reducer.toList(), ["system:index"]).get("list");
  indexList.evaluate(function(indexs) {
    for (var i=0; i<indexs.length; i++) {
      var image = imgCol.filter(ee.Filter.eq("system:index", indexs[i])).first();
      // image = image.toInt16();
      image = image.clip(roi);
      Map.addLayer(image, rgbVis, indexs[i]);//查看具体的遥感影像
      //tif数据下载
      Export.image.toDrive({
        image: image,
        description: 'sentinel_'+indexs[i],
        fileNamePrefix: 'sentinel_'+indexs[i],
        folder: 'sentinel',
        region: roi,
        scale: 10,
        crs: "EPSG:4326",
        maxPixels: 1e13
      });
    }
  });
}
exportImageCollection(dataset);
4 月平均数据的变化趋势
注意:分辨率为10m
代码如下(以鹿邑县为例):
//以鹿邑县为例子
var geometry = ee.FeatureCollection('users/www1573979951/luyixian')
Map.centerObject(geometry,7)
//颜色设置
var colorizedVis = {
  min: -0.8,
  max: 0.8,
  palette: ['blue', 'white', 'green'],
};

//使用QA波段去云
function maskS2clouds(image) {
  var qa = image.select('QA60');
  // Bits 10 and 11 are clouds and cirrus, respectively.
  var cloudBitMask = 1 << 10;
  var cirrusBitMask = 1 << 11;
  // Both flags should be set to zero, indicating clear conditions.
  var mask = qa.bitwiseAnd(cloudBitMask).eq(0)
      .and(qa.bitwiseAnd(cirrusBitMask).eq(0));
  return image.updateMask(mask).divide(10000).set(image.toDictionary(image.propertyNames()));
}

//NDVI的计算公式
function createNDVI(image){
  var ndvi = image.normalizedDifference(["B8","B4"]).rename('NDVI');
  return image.addBands(ndvi);
}

//特别注意的是,在数学变换之后,保持原始影像的属性,所以这里.set(image.toDictionary(image.propertyNames()));
var S2_COL = ee.ImageCollection("COPERNICUS/S2")
.filterDate("2020-01-01", "2020-12-31")
.filter(ee.Filter.lt('CLOUDY_PIXEL_PERCENTAGE',20))
.filterBounds(geometry)
.map(maskS2clouds)
.map(createNDVI)
.select('NDVI');
print(S2_COL)
Map.addLayer(S2_COL.median().clip(geometry), colorizedVis, 'col');


var years = ee.List.sequence(2020, 2020);
var months = ee.List.sequence(1, 12);
var S2_monthlymeanNDVI =  ee.ImageCollection.fromImages(
  years.map(function (y) {
    return months.map(function(m) {
    return S2_COL.filter(ee.Filter.calendarRange(y,y, 'year')).filter(ee.Filter.calendarRange(m, m, 'month')).mean().set('year', y).set('month', m).set('system:time_start', ee.Date.fromYMD(y, m, 1));
    });
  }).flatten()
);
// Create a monthly time series chart.
var plotNDVI = ui.Chart.image.seriesByRegion(S2_monthlymeanNDVI, geometry,ee.Reducer.mean(),
'NDVI',500,'system:time_start')
              .setChartType('LineChart').setOptions({
                interpolateNulls: true,
                title: 'NDVI Monthly time series',
                hAxis: {title: 'Date'},
                vAxis: {title: 'NDVI',viewWindowMode: 'explicit', viewWindow: {max: 0.7,min: 0.3,},gridlines: {count: 10,}},
                trendlines: { 0: {title: 'NDVI_trend',type:'linear', showR2: true,  color:'red', visibleInLegend: true}}});
// Display.
print(plotNDVI);
5 月平均影像数据的查看和下载
注意:分辨率为10m
5.1 NDVI值影像获取
代码如下(以鹿邑县为例):
//以鹿邑县为例子
var geometry = ee.FeatureCollection('users/www1573979951/luyixian')
Map.centerObject(geometry,7)
//颜色设置
var colorizedVis = {
  min: -0.8,
  max: 0.8,
  palette: ['blue', 'white', 'green'],
};

//使用QA波段去云
function maskS2clouds(image) {
  var qa = image.select('QA60');
  // Bits 10 and 11 are clouds and cirrus, respectively.
  var cloudBitMask = 1 << 10;
  var cirrusBitMask = 1 << 11;
  // Both flags should be set to zero, indicating clear conditions.
  var mask = qa.bitwiseAnd(cloudBitMask).eq(0)
      .and(qa.bitwiseAnd(cirrusBitMask).eq(0));
  return image.updateMask(mask).divide(10000).set(image.toDictionary(image.propertyNames()));
}

//NDVI的计算公式
function createNDVI(image){
  var ndvi = image.normalizedDifference(["B8","B4"]).rename('NDVI');
  return image.addBands(ndvi);
}

//特别注意的是,在数学变换之后,保持原始影像的属性,所以这里.set(image.toDictionary(image.propertyNames()));
var S2_COL = ee.ImageCollection("COPERNICUS/S2")
.filterDate("2020-01-01", "2020-12-31")
.filter(ee.Filter.lt('CLOUDY_PIXEL_PERCENTAGE',20))
.filterBounds(geometry)
.map(maskS2clouds)
.map(createNDVI)
.select('NDVI');

// Map.addLayer(S2_COL.mean().clip(geometry), colorizedVis, 'col');


var years = ee.List.sequence(2020, 2020);
var months = ee.List.sequence(1, 12);
var S2_monthlymeanNDVI =  ee.ImageCollection.fromImages(
  years.map(function (y) {
    return months.map(function(m) {
    return S2_COL.filter(ee.Filter.calendarRange(y,y, 'year')).filter(ee.Filter.calendarRange(m, m, 'month')).mean().set('year', y).set('month', m).set('system:time_start', ee.Date.fromYMD(y, m, 1));
    });
  }).flatten()
);

print(S2_monthlymeanNDVI)

function exportImageCollection(imgCol) {
  var indexList = imgCol.reduceColumns(ee.Reducer.toList(), ["system:index"]).get("list");
  indexList.evaluate(function(indexs) {
    for (var i=0; i<indexs.length; i++) {
      var image = imgCol.filter(ee.Filter.eq("system:index", indexs[i])).first();
      Map.addLayer(image.clip(geometry), colorizedVis, 'sentinel_10_ndvi_2020_'+indexs[i+1]);
       //tif数据下载
      Export.image.toDrive({
        image: image.clip(geometry),
        description: 'sentinel_10_ndvi_2020_'+indexs[i+1],
        fileNamePrefix: 'sentinel_10_ndvi_2020_'+indexs[i+1],
        folder: 'sentinel_10',
        region: geometry,
        scale: 10,
        crs: "EPSG:4326",
        maxPixels: 1e13
      });
    }
  });
}
exportImageCollection(S2_monthlymeanNDVI);
5.2 原始影像获取
代码如下(以鹿邑县9月份为例)
var roi = ee.FeatureCollection('users/www1573979951/luyixian');;  //table为自己上传的矢量边界

//去云
function maskS2clouds(image) {
  var qa = image.select('QA60');
  // Bits 10 and 11 are clouds and cirrus, respectively.
  var cloudBitMask = 1 << 10;
  var cirrusBitMask = 1 << 11;
  // Both flags should be set to zero, indicating clear conditions.
  var mask = qa.bitwiseAnd(cloudBitMask).eq(0)
      .and(qa.bitwiseAnd(cirrusBitMask).eq(0));
  return image.updateMask(mask).divide(10000);
}

//按条件筛选影像
var dataset = ee.ImageCollection('COPERNICUS/S2')
                  .filterBounds(roi)
                  .filterDate('2020-09-01','2020-09-30')//自己更改时间时间获取影像
                  .filter(ee.Filter.lt('CLOUDY_PIXEL_PERCENTAGE', 10))
                  .map(maskS2clouds);
print(dataset)
var rgbVis = {
  min: 0.0,
  max: 0.3,
  bands: ['B4', 'B3', 'B2'],
};

Map.addLayer(dataset.mean().clip(roi), rgbVis, 'dataset');
Map.centerObject(roi,7)

//显示roi
var styling = {color:"red",fillColor:"00000000"};
Map.addLayer(roi.style(styling),{},"boundary")
//tif数据下载
Export.image.toDrive({
  image: dataset.mean().clip(roi),
  description: 'sentinel_09',
  fileNamePrefix: 'sentinel_09',
  folder: 'sentinel',
  region: roi,
  scale: 10,
  crs: "EPSG:4326",
  maxPixels: 1e13
});


