Matlab绘制散点的95%置信区间图
Matlab常绘制95%置信区间图,主要使用到patch函数。
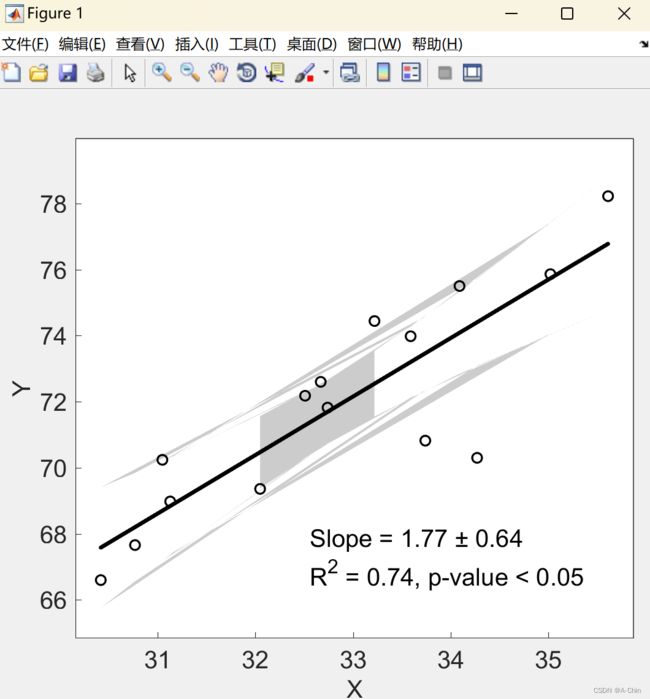
如果直接使用散点进行拟合,在patch函数绘制95%置信区间时,会绘制的很乱,这个是由于patch函数所导致的,其实这个问题在 Matlab绘制95%置信区间图 中已经讲到过,这里面使用的也是散点图。
如下个代码是错误示范:
%%
clc;
clear;

figure(1);

colorstr = [0.4940 0.184 0.5560];
colorstr = [0 0 0];

gc = get(gca);
set(gcf, 'position', [0, 50, 535, 500]);

set(gca, 'FontName', 'Arial', 'FontSize', 15);
xlabel('X', 'FontSize', 15, 'FontName', 'Arial');
ylabel('Y', 'FontSize', 15, 'FontName', 'Arial');
hold on;

x = [32.05, 32.74, 33.74, 30.42, 30.77, 33.59, 35.02, 31.13, 32.67, 32.51, 31.05, 34.27, 35.61, 34.09, 33.22]';
y = [69.36, 71.82, 70.82, 66.60, 67.66, 73.98, 75.86, 68.98, 72.60, 72.18, 70.24, 70.30, 78.22, 75.50, 74.44]';

[p, s] = polyfit(x, y, 1);
y1 = polyval(p, x);

wlb = LinearModel.fit(x, y);
trends = wlb.Coefficients.Estimate(2);
change = wlb.Fitted(end) - wlb.Fitted(1);
changerate = (change / wlb.Fitted(1)) * 100;
pvalues = wlb.Coefficients.pValue(2);
R2 = wlb.Rsquared.Ordinary;

[b, bint, r, rint, stats] = regress(y, [ones(size(y)) x]);
bint(2, :)

[yfit, dy] = polyconf(p, x, s, 'predopt', 'curve');
hold on;
patch([x; flipud(x)], [yfit - dy; flipud(yfit + dy)], colorstr, 'FaceA', 0.20, 'EdgeA', 0);
hold on;
s_p1 = scatter(x, y, 'MarkerEdgeColor', colorstr);
s_p1.LineWidth = 1.25;
s_p1 = plot(x, y1, 'Color', colorstr, 'LineStyle', '-', 'linewidth', 2.5);
hold on;

info1 = strcat('Slope =', 32, num2str(trends, '%.2f'), 32, '±', 32, num2str((bint(2, 2) - bint(2, 1)) / 2, '%.2f'));
info2 = strcat('R^2 = ', 32, num2str(R2, '%.2f'));
if pvalues < 0.05
    info2 = strcat(info2, ',', 32, 'p-value < 0.05');
else
    info2 = strcat(info2, ',', 32, 'p-value =', 32, num2str(pvalues, '%.2f'));
end

xlim([min(x) - 0.05 * (max(x) - min(x)) max(x) + 0.05 * (max(x) - min(x))]);
ylim([min(y) - 0.15 * (max(y) - min(y)) max(y) + 0.15 * (max(y) - min(y))]);

hold on;
rr = axis;
plot(rr(1:2), [rr(4), rr(4)], 'k-', [rr(2), rr(2)], rr(3:4), 'k-');

text((rr(1) + (rr(2) - rr(1)) * 0.42), (rr(4) - (rr(4) - rr(3)) * 0.80), info1, 'FontSize', 15, 'FontName', 'Arial');
text((rr(1) + (rr(2) - rr(1)) * 0.42), (rr(4) - (rr(4) - rr(3)) * 0.87), info2, 'FontSize', 15, 'FontName', 'Arial');

set(gca, 'looseInset', [0.12, 0.03, 0.03, 0.08]);
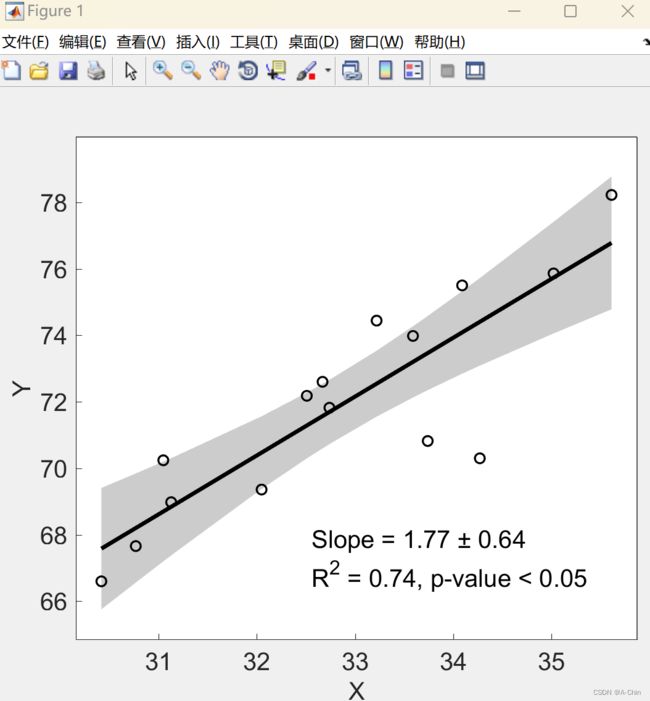
为了解决这个问题,需要先对x轴的数据进行排序,y轴数据的位置随x轴数据进行调整,正确的示范如下:
%%
clc;
clear;

figure(1);

colorstr = [0.4940 0.184 0.5560];
colorstr = [0 0 0];

gc = get(gca);
set(gcf, 'position', [0, 50, 535, 500]);

set(gca, 'FontName', 'Arial', 'FontSize', 15);
xlabel('X', 'FontSize', 15, 'FontName', 'Arial');
ylabel('Y', 'FontSize', 15, 'FontName', 'Arial');
hold on;

x = [32.05, 32.74, 33.74, 30.42, 30.77, 33.59, 35.02, 31.13, 32.67, 32.51, 31.05, 34.27, 35.61, 34.09, 33.22]';
y = [69.36, 71.82, 70.82, 66.60, 67.66, 73.98, 75.86, 68.98, 72.60, 72.18, 70.24, 70.30, 78.22, 75.50, 74.44]';

[X, I] = sort(x);
Y = y(I);

x = X;
y = Y;

[p, s] = polyfit(x, y, 1);
y1 = polyval(p, x);

wlb = LinearModel.fit(x, y);
trends = wlb.Coefficients.Estimate(2);
change = wlb.Fitted(end) - wlb.Fitted(1);
changerate = (change / wlb.Fitted(1)) * 100;
pvalues = wlb.Coefficients.pValue(2);
R2 = wlb.Rsquared.Ordinary;

[b, bint, r, rint, stats] = regress(y, [ones(size(y)) x]);
bint(2, :)

[yfit, dy] = polyconf(p, x, s, 'predopt', 'curve');
hold on;
patch([x; flipud(x)], [yfit - dy; flipud(yfit + dy)], colorstr, 'FaceA', 0.20, 'EdgeA', 0);
hold on;
s_p1 = scatter(x, y, 'MarkerEdgeColor', colorstr);
s_p1.LineWidth = 1.25;
s_p1 = plot(x, y1, 'Color', colorstr, 'LineStyle', '-', 'linewidth', 2.5);
hold on;

info1 = strcat('Slope =', 32, num2str(trends, '%.2f'), 32, '±', 32, num2str((bint(2, 2) - bint(2, 1)) / 2, '%.2f'));
info2 = strcat('R^2 = ', 32, num2str(R2, '%.2f'));
if pvalues < 0.05
    info2 = strcat(info2, ',', 32, 'p-value < 0.05');
else
    info2 = strcat(info2, ',', 32, 'p-value =', 32, num2str(pvalues, '%.2f'));
end

xlim([min(x) - 0.05 * (max(x) - min(x)) max(x) + 0.05 * (max(x) - min(x))]);
ylim([min(y) - 0.15 * (max(y) - min(y)) max(y) + 0.15 * (max(y) - min(y))]);

hold on;
rr = axis;
plot(rr(1:2), [rr(4), rr(4)], 'k-', [rr(2), rr(2)], rr(3:4), 'k-');

text((rr(1) + (rr(2) - rr(1)) * 0.42), (rr(4) - (rr(4) - rr(3)) * 0.80), info1, 'FontSize', 15, 'FontName', 'Arial');
text((rr(1) + (rr(2) - rr(1)) * 0.42), (rr(4) - (rr(4) - rr(3)) * 0.87), info2, 'FontSize', 15, 'FontName', 'Arial');

set(gca, 'looseInset', [0.12, 0.03, 0.03, 0.08]);
欢迎大家批评指正。

