python 过滤曲线噪点(滤波)
import numpy as np
import matplotlib.pyplot as plt
from scipy import signal

# 生成示例信号
t = np.linspace(0, 1, 1000)
x = np.sin(2 * np.pi * 5 * t) + np.sin(2 * np.pi * 20 * t) + np.random.randn(len(t)) * 0.2

# 设计低通滤波器
order = 3  # 滤波器阶数
cutoff_freq = 0.9  # 截止频率(Hz)
b, a = signal.butter(order, cutoff_freq, fs=2, btype='low', analog=False, output='ba')

# 应用滤波器
filtered_x = signal.lfilter(b, a, x)

# 绘制原始信号和滤波后的信号
plt.figure(figsize=(8, 6))
plt.plot(t, x, label='原始信号')
plt.plot(t, filtered_x, label='滤波后的信号')
plt.xlabel('时间')
plt.ylabel('振幅')
plt.legend()
plt.show()

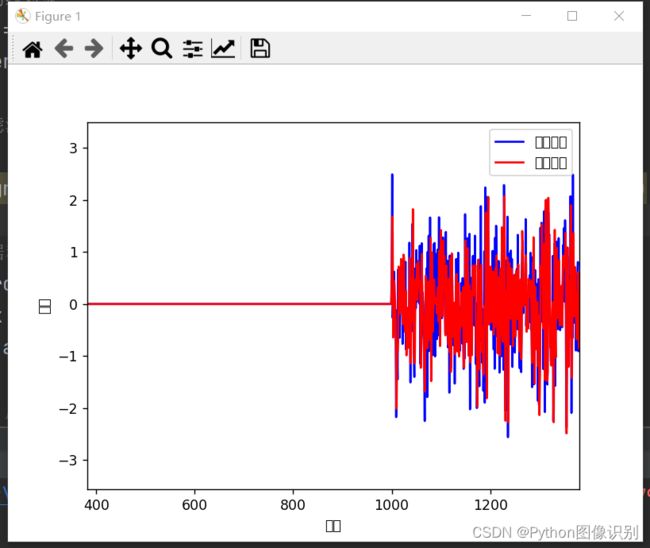
动画效果展示,实时进行平滑:
import numpy as np
import matplotlib.pyplot as plt
from matplotlib.animation import FuncAnimation
from scipy import signal

# 创建图形对象和子图
fig, ax = plt.subplots()

# 设置空白的线对象
line_raw, = ax.plot([], [], 'b-', label='原始数据')
line_filtered, = ax.plot([], [], 'r-', label='平滑数据')

# 设计低通滤波器
order = 4
b, a = signal.butter(3, 0.8, btype='low', analog=False, output='ba')

# 初始化数据和滤波结果
x = np.zeros(1000)
filtered_x = np.zeros_like(x)
time = np.arange(len(x))

# 更新函数,用于每一帧的绘制
def update(frame):
    global x, filtered_x, time

    # 生成新数据
    new_data = np.random.randn()  # 这里示例使用随机数作为新数据

    # 更新数据
    x = np.append(x[1:], new_data)
    time = np.append(time[1:], time[-1] + 1)

    # 应用滤波器
    filtered_x = signal.lfilter(b, a, x)

    # 更新绘图数据
    line_raw.set_data(time, x)
    line_filtered.set_data(time, filtered_x)

    # 设置轴的范围
    ax.set_xlim(time[0], time[-1])
    ax.set_ylim(min(x.min(), filtered_x.min()) - 1, max(x.max(), filtered_x.max()) + 1)

# 创建动画
ani = FuncAnimation(fig, update, frames=range(1000), interval=10)

# 设置图形界面
plt.xlabel('时间')
plt.ylabel('数值')
plt.legend()

# 显示动画
plt.show()