echarts 实现tooltip自动轮播显示,鼠标悬浮时暂停
在ECharts中,可以通过设置 tooltip.trigger="axis" ,来显示数据轴上的提示框。
实现tooltip的自动轮播显示,结合使用 setInterval()和 dispatchAction()方法。
获取chart DOM 实例,监听鼠标事件,悬浮时清空定时器,鼠标离开开启定时器,继续轮播。
“vue”: “^3.2.47”,
“echarts”: “^5.4.1”,
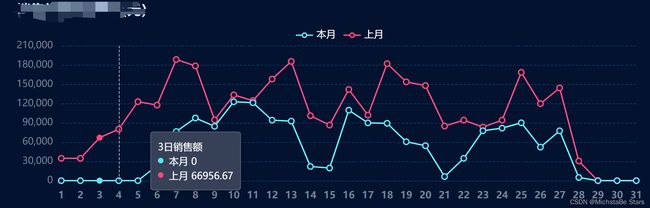
- 效果
实现步骤
- 设置
tooltip
tooltip: {
	trigger: 'axis',
},
- 获取当前图表数据项length,并定义
currentIndex用于记录当前显示的数据项索引。
const xData = Array.from({ length: 31 }, (_, i) => i + 1);
let currentIndex = -1; // 初始值为-1,表示未开始轮播
- 使用
setInterval()定时触发dispatchAction(),切换tooltip的显示内容。
let timer = <TimerType>undefined;
let currentIndex = -1;

// 切换tooltip
function switchTooltip(myChart) {
	// 取消之前高亮的图形
	myChart.dispatchAction({
		type: 'downplay',
		seriesIndex: 1,
		dataIndex: currentIndex,
	});

	currentIndex = (currentIndex + 1) % 31;
	// 高亮当前图形
	myChart.dispatchAction({
		type: 'highlight',
		seriesIndex: 1,
		dataIndex: currentIndex,
	});
	// 显示tooltip
	myChart.dispatchAction({
		type: 'showTip',
		seriesIndex: 1,
		dataIndex: currentIndex,
	});
}

function startTooltipLoop(myChart) {
	timer = setInterval(() => switchTooltip(myChart), 3000);
}

function closeSwitchTooltip() {
	timer = undefined;
	clearInterval(timer);
}

// 开启轮播
startTooltipLoop(myChart);
- 监听鼠标事件,悬浮时停止轮播,离开继续轮播
const myChart = echarts.init(unref(lineChartIntanse)!);

// 鼠标悬浮,停止轮播
myChart.on('mousemove', function () {
	closeSwitchTooltip();
});

// 鼠标离开,继续轮播
myChart.on('mousedown', function () {
	startTooltipLoop(myChart);
});
- 完整代码
- lineChart.ts
import * as echarts from 'echarts';
import { Ref } from 'vue';
import type { SalesTrendComparison, TimerType } from '../types';
import { getSize } from '../utils';

type EChartsOption = echarts.EChartsOption;

export function useLineChart(lineChartIntanse: Ref<Nullable<HTMLElement>>, data: SalesTrendComparison[]) {
	let timer = <TimerType>undefined;
	let currentIndex = -1;

	watch(
		() => data,
		async (data: Recordable) => {
			closeSwitchTooltip();
			await nextTick();
			const getLineChartInstance = unref(lineChartIntanse) ? echarts.getInstanceByDom(unref(lineChartIntanse)!) : null;
			getLineChartInstance ? getLineChartInstance.setOption({ series: getSeries(data) }) : initLineChart();
		},
		{ deep: true, immediate: true }
	);

	function initLineChart() {
		const myChart = echarts.init(unref(lineChartIntanse)!);

		const option = getOption();

		startTooltipLoop(myChart);

		myChart.on('mousemove', function () {
			closeSwitchTooltip();
		});

		myChart.on('mousedown', function () {
			startTooltipLoop(myChart);
		});

		myChart.setOption(option);
	}

	function getOption() {
		const color = '#748497';
		const xData = Array.from({ length: 31 }, (_, i) => i + 1);
		const option: EChartsOption = {
			tooltip: {
				trigger: 'axis',
				backgroundColor: '#364057',
				borderColor: 'rgba(255,255,255,0.2)',
				textStyle: {
					color: '#FFFFFF',
					lineHeight: getSize(12),
					fontSize: getSize(14),
					fontFamily: 'PingFangSC-Regular, PingFang SC',
				},
				axisPointer: {
					type: 'line',
				},
				formatter: (params) => {
					let result = '';
					params.forEach((item, i) => {
						const { seriesName, data, axisValue } = item;
						const color = seriesName === '上月' ? '#FB497C' : '#5BE4F7';
						if (i === 0) {
							result += `${axisValue}日销售额
`;
						}
						result += markDot(color) + `${seriesName} ${data?.[1]}
`;
					});
					return result;
				},
			},
			legend: {
				textStyle: {
					color: '#fff',
					fontSize: getSize(14),
					fontWeight: 500,
					lineHeight: getSize(12),
					fontFamily: 'PingFangSC-Medium, PingFang SC',
				},
				itemHeight: getSize(8),
			},
			grid: {
				top: '10%',
				left: '0',
				right: '4%',
				bottom: '7%',
				containLabel: true,
			},
			xAxis: {
				type: 'category',
				boundaryGap: false,
				data: xData,
				axisLabel: {
					interval: 0,
					margin: getSize(13),
					color,
					fontSize: getSize(14),
					lineHeight: getSize(18),
					fontWeight: 600,
					fontFamily: 'PingFangSC-Regular, PingFang SC',
				},
				axisTick: { show: false },
				axisLine: {
					lineStyle: { color: '#0C3760', type: 'dashed', width: getSize(1) },
				},
			},
			yAxis: {
				type: 'value',
				splitLine: {
					lineStyle: { color: '#0C3760', type: 'dashed', width: getSize(1) },
				},
				axisLabel: {
					color,
					fontFamily: 'PingFangSC-Medium, PingFang SC',
					fontWeight: 500,
					fontSize: getSize(14),
					lineHeight: getSize(20),
					margin: getSize(12),
				},
			},

			series: getSeries(data),
		};

		return option;
	}

	// 生成大小一样样色不同的圆点
	function markDot(color) {
		let domHtml =
			'+
			'display: inline-block;' +
			'margin-right: 8px;' +
			'margin-bottom: 2px;' +
			'border-radius: 6px;' +
			'width: 0.4167vw;' +
			'height: 0.7407vh;' +
			`background-color: ${color}` +
			'">';
		return domHtml;
	}

	function getSeries(data): EChartsOption['series'] {
		const common = {
			type: 'line',
			stack: 'Total',
			animation: false,
			symbol: 'circle',
			symbolSize: getSize(8),
		};
		return data.map((item) => {
			return {
				name: item.name,
				data: item.data,
				...common,
				emphasis: {
					itemStyle: {
						color: item.color,
						borderWidth: 0,
					},
				},
				itemStyle: {
					color: '#03122F',
					borderWidth: getSize(2),
					borderColor: item.color,
				},
				lineStyle: {
					color: item.color,
					width: getSize(2),
				},
				z: item.name === '本月' ? 6 : 1,
			};
		}) as EChartsOption['series'];
	}

	// 切换tooltip
	function switchTooltip(myChart) {
		// 取消之前高亮的图形
		myChart.dispatchAction({
			type: 'downplay',
			seriesIndex: 1,
			dataIndex: currentIndex,
		});

		currentIndex = (currentIndex + 1) % 31;
		// 高亮当前图形
		myChart.dispatchAction({
			type: 'highlight',
			seriesIndex: 1,
			dataIndex: currentIndex,
		});
		// 显示tooltip
		myChart.dispatchAction({
			type: 'showTip',
			seriesIndex: 1,
			dataIndex: currentIndex,
		});
	}

	function startTooltipLoop(myChart, delay = 3000) {
		timer = setInterval(() => switchTooltip(myChart), delay);
	}

	function closeSwitchTooltip() {
		timer = undefined;
		clearInterval(timer);
	}

	const getSize = (size: number) => (document.body.clientWidth / 1920) * size;

	// 自适应
	const onLineChartResize = () => {
		if (unref(lineChartIntanse)) {
			const chartInstance = echarts.getInstanceByDom(unref(lineChartIntanse)!);
			const option = getOption();
			chartInstance?.setOption(option);
			chartInstance?.resize();
		}
	};

	return { onLineChartResize, switchTooltip, closeSwitchTooltip };
}
- 引用
	const saleRef = ref>(null);
	const { onLineChartResize, closeSwitchTooltip } = useLineChart(saleRef, data);

	window.addEventListener('resize', () => resizeChart());

	onBeforeUnmount(() => {
		closeSwitchTooltip();
		window.removeEventListener('resize', () => resizeChart());
	});