Matplotlib可视化
Matplotlib可视化
1、导包
import numpy as np
import matplotlib as mpl
import matplotlib.pyplot as plt
%matplotlib inline
2、颜色缩写
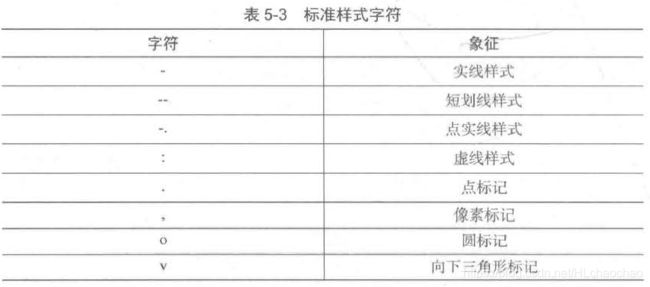
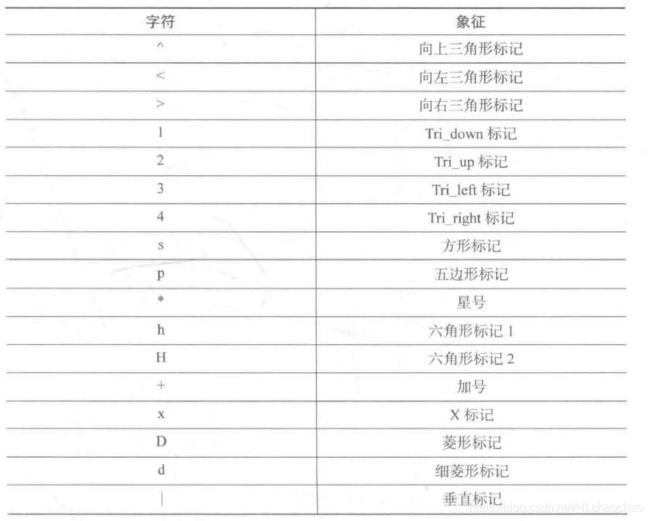
3、标准样式字符
4、一维数据集
plt.figure(figsize=(7,4))
plt.plot(y.cumsum(),'b',lw=1.5)#线条颜色和粗细设置
plt.plot(y.cumsum(),'r*') #点的设置颜色和形状
plt.grid(True)
plt.axis('tight')
plt.xlabel('index')
plt.ylabel('value')
plt.title('A Simple Plot')
5、二维数据集
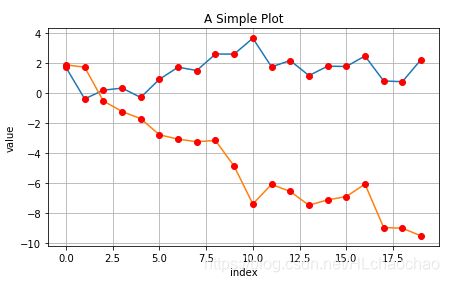
np.random.seed(2000)
y = np.random.standard_normal((20,2)).cumsum(axis=0)
plt.figure(figsize=(7,4))
plt.plot(y,lw=1.5)
plt.plot(y,'rb')
plt.grid(True)
plt.axis('tight')
plt.xlabel('index')
plt.ylabel('value')
plt.title('A Simple Plot')
plt.figure(figsize=(7,4))
plt.plot(y[:,0],lw=1.5,label='1st')
plt.plot(y[:,1],lw=1.5,label = '2nd')
plt.plot(y,'ro')
plt.grid(True)
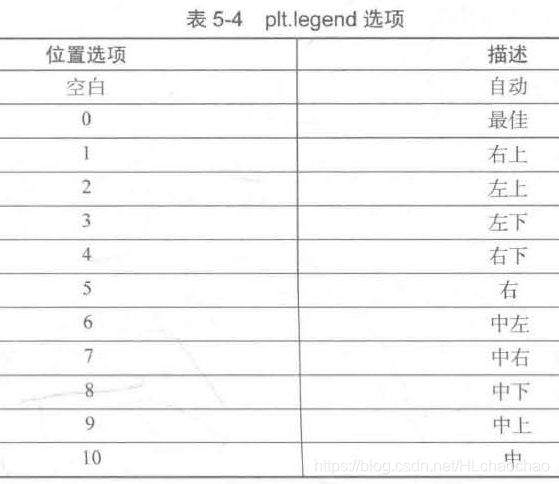
plt.legend(loc=0) #设置标签显示的位置
plt.axis('tight')
plt.xlabel('index')
plt.ylabel('value')
plt.title('A Simple Plot')

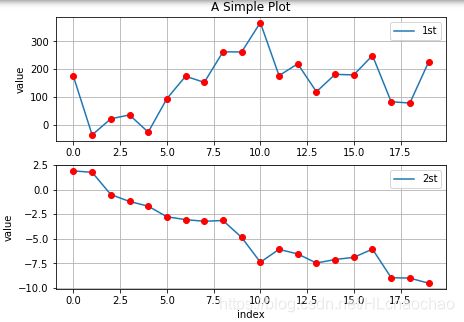
 当两个数据的大小差别非常大的时候,导致那条数据值较小的数据集出现视觉丢失。解决这个问题的方式有两种:
- 使用2个y轴(左/右)
- 使用两个子图(上/下,左/右)。
x第一种解决方法如下:
fig,ax1 = plt.subplots()
plt.plot(y[:,0],'b',lw=1.5,label='1st')
plt.plot(y[:,0],'ro')
plt.grid(True)
plt.legend(loc=8)
plt.axis('tight')
plt.xlabel('index')
plt.ylabel('value 1st')
plt.title('A Simple Plot')
ax2 = ax1.twinx()
plt.plot(y[:,1],'g',lw=1.5,label='2nd')
plt.plot(y[:,1],'ro')
plt.legend(loc=0)
plt.ylabel('value 2nd')
plt.figure(figsize=(7,5))
plt.subplot(211)
plt.plot(y[:,0],lw=1.5,label='1st')
plt.plot(y[:,0],'ro')
plt.grid(True)
plt.legend(loc=0)
plt.axis('tight')
plt.ylabel('value')
plt.title('A Simple Plot')
plt.subplot(212)
plt.plot(y[:,1],lw=1.5,label='2st')
plt.plot(y[:,1],'ro')
plt.grid(True)
plt.legend(loc=0)
plt.axis('tight')
plt.xlabel('index')
plt.ylabel('value')
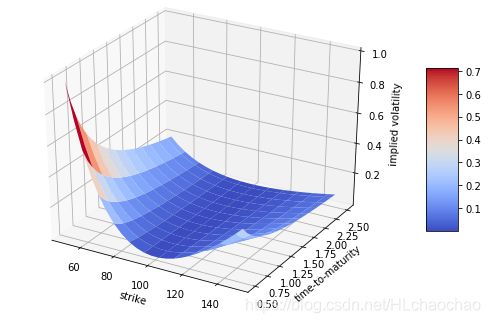
trike = np.linspace(50,150,24)
ttm = np.linspace(0.5,2.5,24)
strike,ttm = np.meshgrid(strike,ttm)
iv = (strike-100)**2/(100*strike)/ttm
from mpl_toolkits.mplot3d import Axes3D
fig = plt.figure(figsize = (9,6))
ax = fig.gca(projection='3d')
surf = ax.plot_surface(strike,ttm,iv,rstride=2,
                      cstride=2,cmap=plt.cm.coolwarm,
                      linewidth=0.5,antialiased=True)
ax.set_xlabel('strike')
ax.set_ylabel('time-to-maturity')
ax.set_zlabel('implied volatility')
fig.colorbar(surf,shrink=0.5,aspect=5)
http://matplotlib.org
http://matplotlib.org/ gallery.html
2D绘图教程:http://matplotlib.org/users/pyplot_ tutorial.html
3D绘图教程:http://matplotlib.org/mpl_toolkits/mplot3d/tutorial.html
